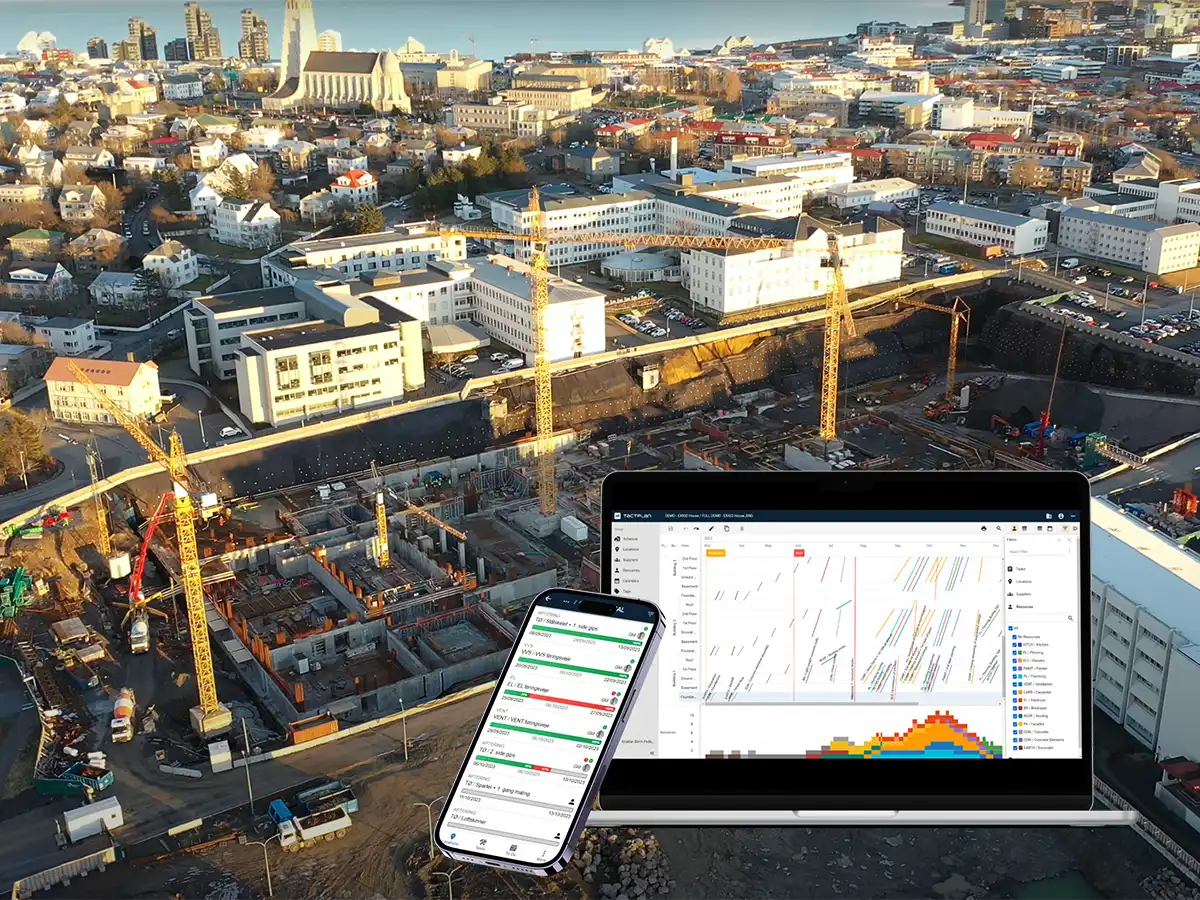
Why Construction Scheduling Fails – and How to Fix It
Effective scheduling in construction is no easy task. Even defining the correct sequence of activities is a challenge, and this is further complicated by the constant updates caused by changes on the construction site. It’s difficult to visualize complex project data using traditional tools like Gantt charts, making it hard to identify potential issues early. This is why problems so often appear on the construction site instead of earlier on the computer screen – where they could have been prevented.
But what if we could catch those issues early, using better tools? Let’s take a look at the example below.
A Real Example: How a Gantt Chart Hides Risks
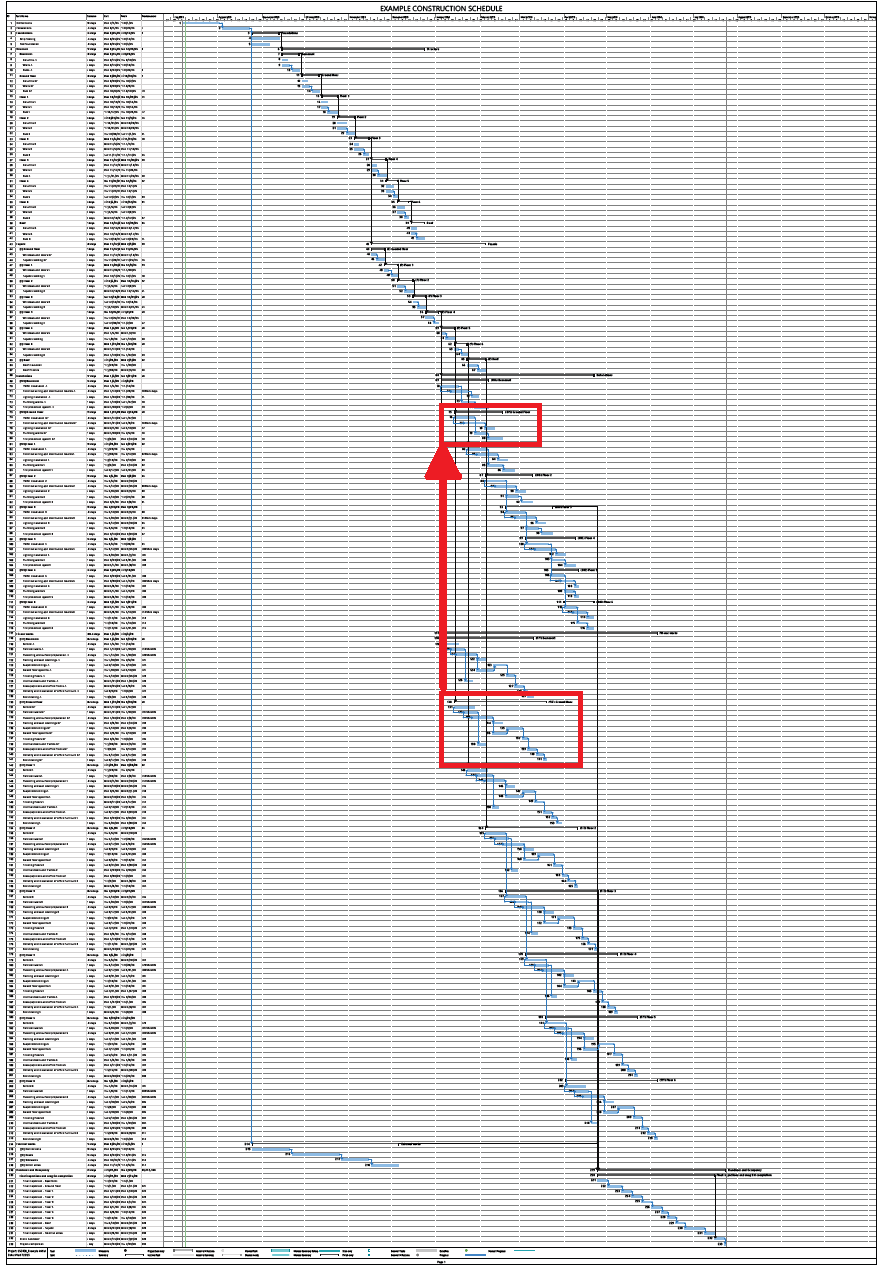
A scheduler has created a plan for anoffice building. It’s a standard Gantt chart – one of the most commonly used tools in construction scheduling software.
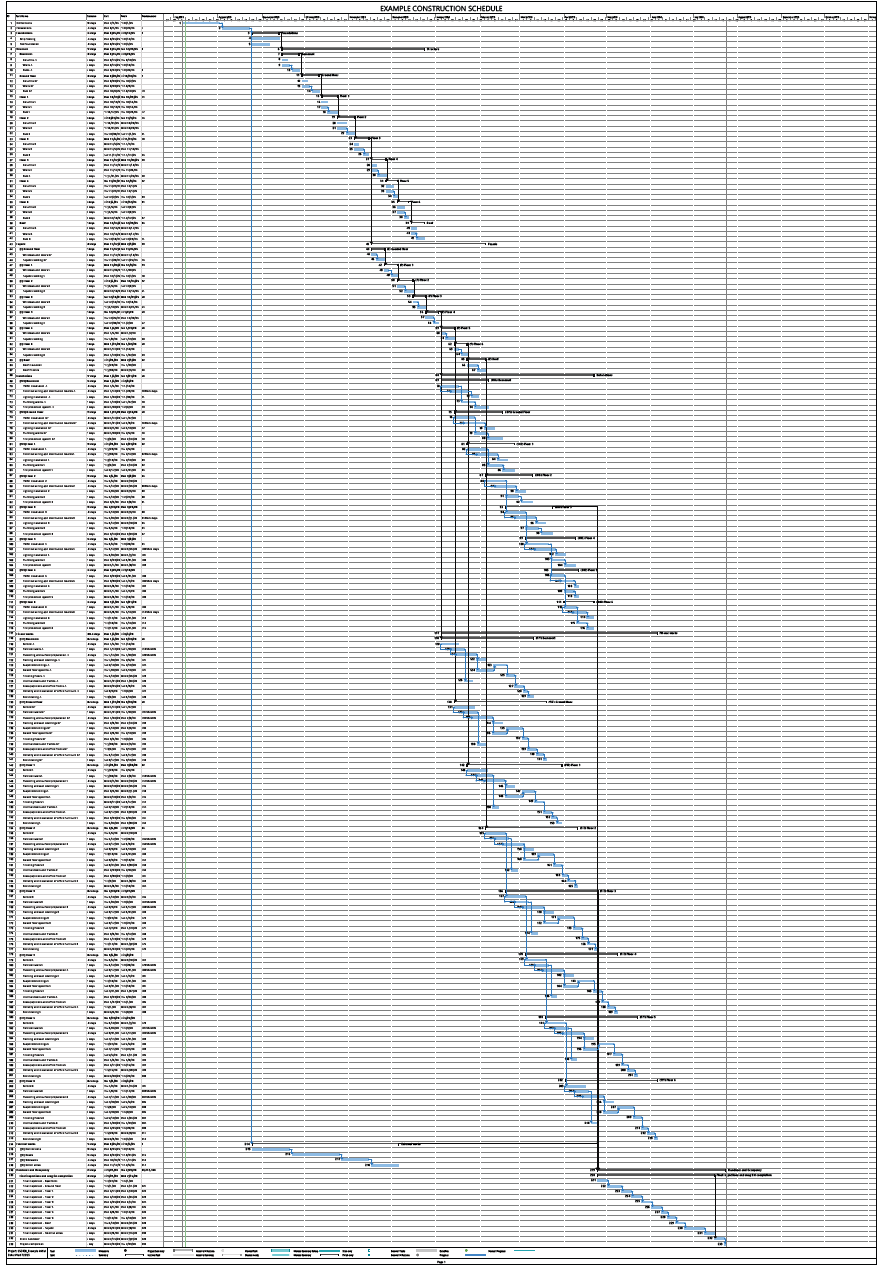
As you can see, the schedule is quite long (233 rows). Analyzing it in detail would require a time-consuming review of many printed pages or scrolling through screen after screen. It lacks a clear overview of work progress across locations or trades.
Let’s assume it’s a fairly decent schedule and sufficient for our example.
What Happens When Reality Changes?
Work began and initially proceeded according to plan. Unfortunately, during the execution of the ground floor, the first two tasks (screed and partition walls) were delayed by one week.
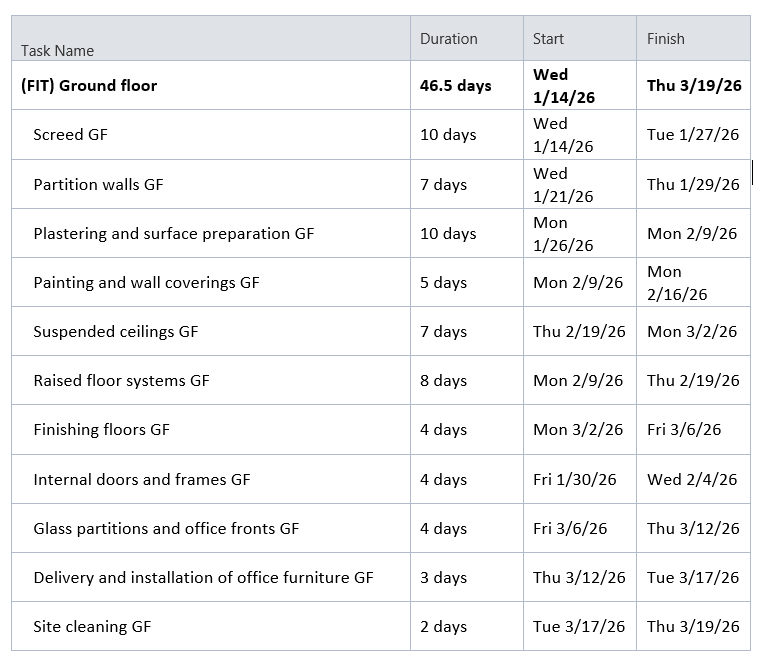
Upon receiving information about the delay,our scheduler extended the durations of the affected tasks. In order to keep the overall deadline, he shortened several subsequent tasks by one day each –in agreement with the contractors.
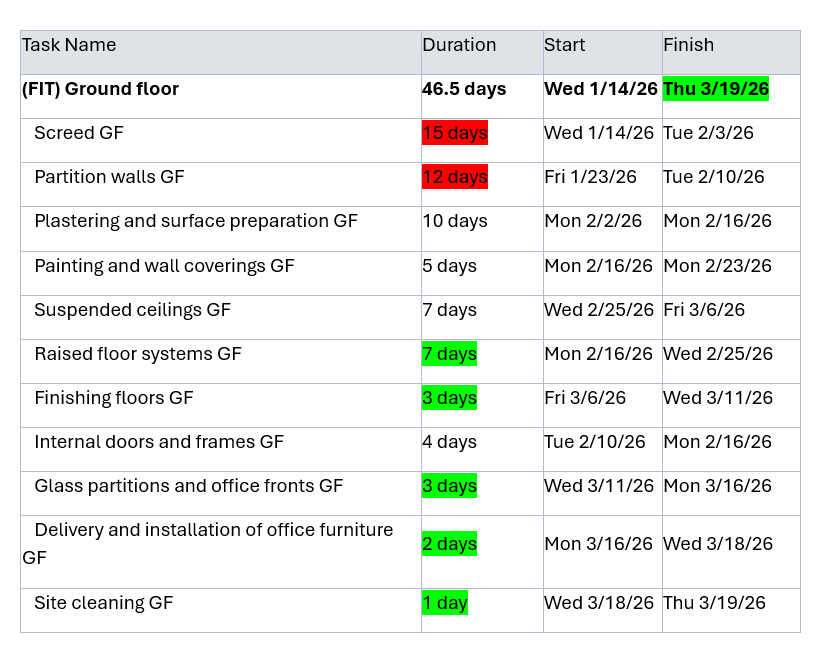
Phew... we made it. Or did we? A few days here and there won’t make a big difference, right? We managed to keep the floor completion deadline.
But did we really?
Why Visualizing Location-Based Workflows Matters
Unfortunately, our scheduler is in for an unpleasant surprise – one that could significantly impact both investor and contractor. Let’s analyze this case using Tactplan – a location-based construction planning software designed to bring clarity and control to your project schedule. After importing the original plan, we get the following unmatched overview:
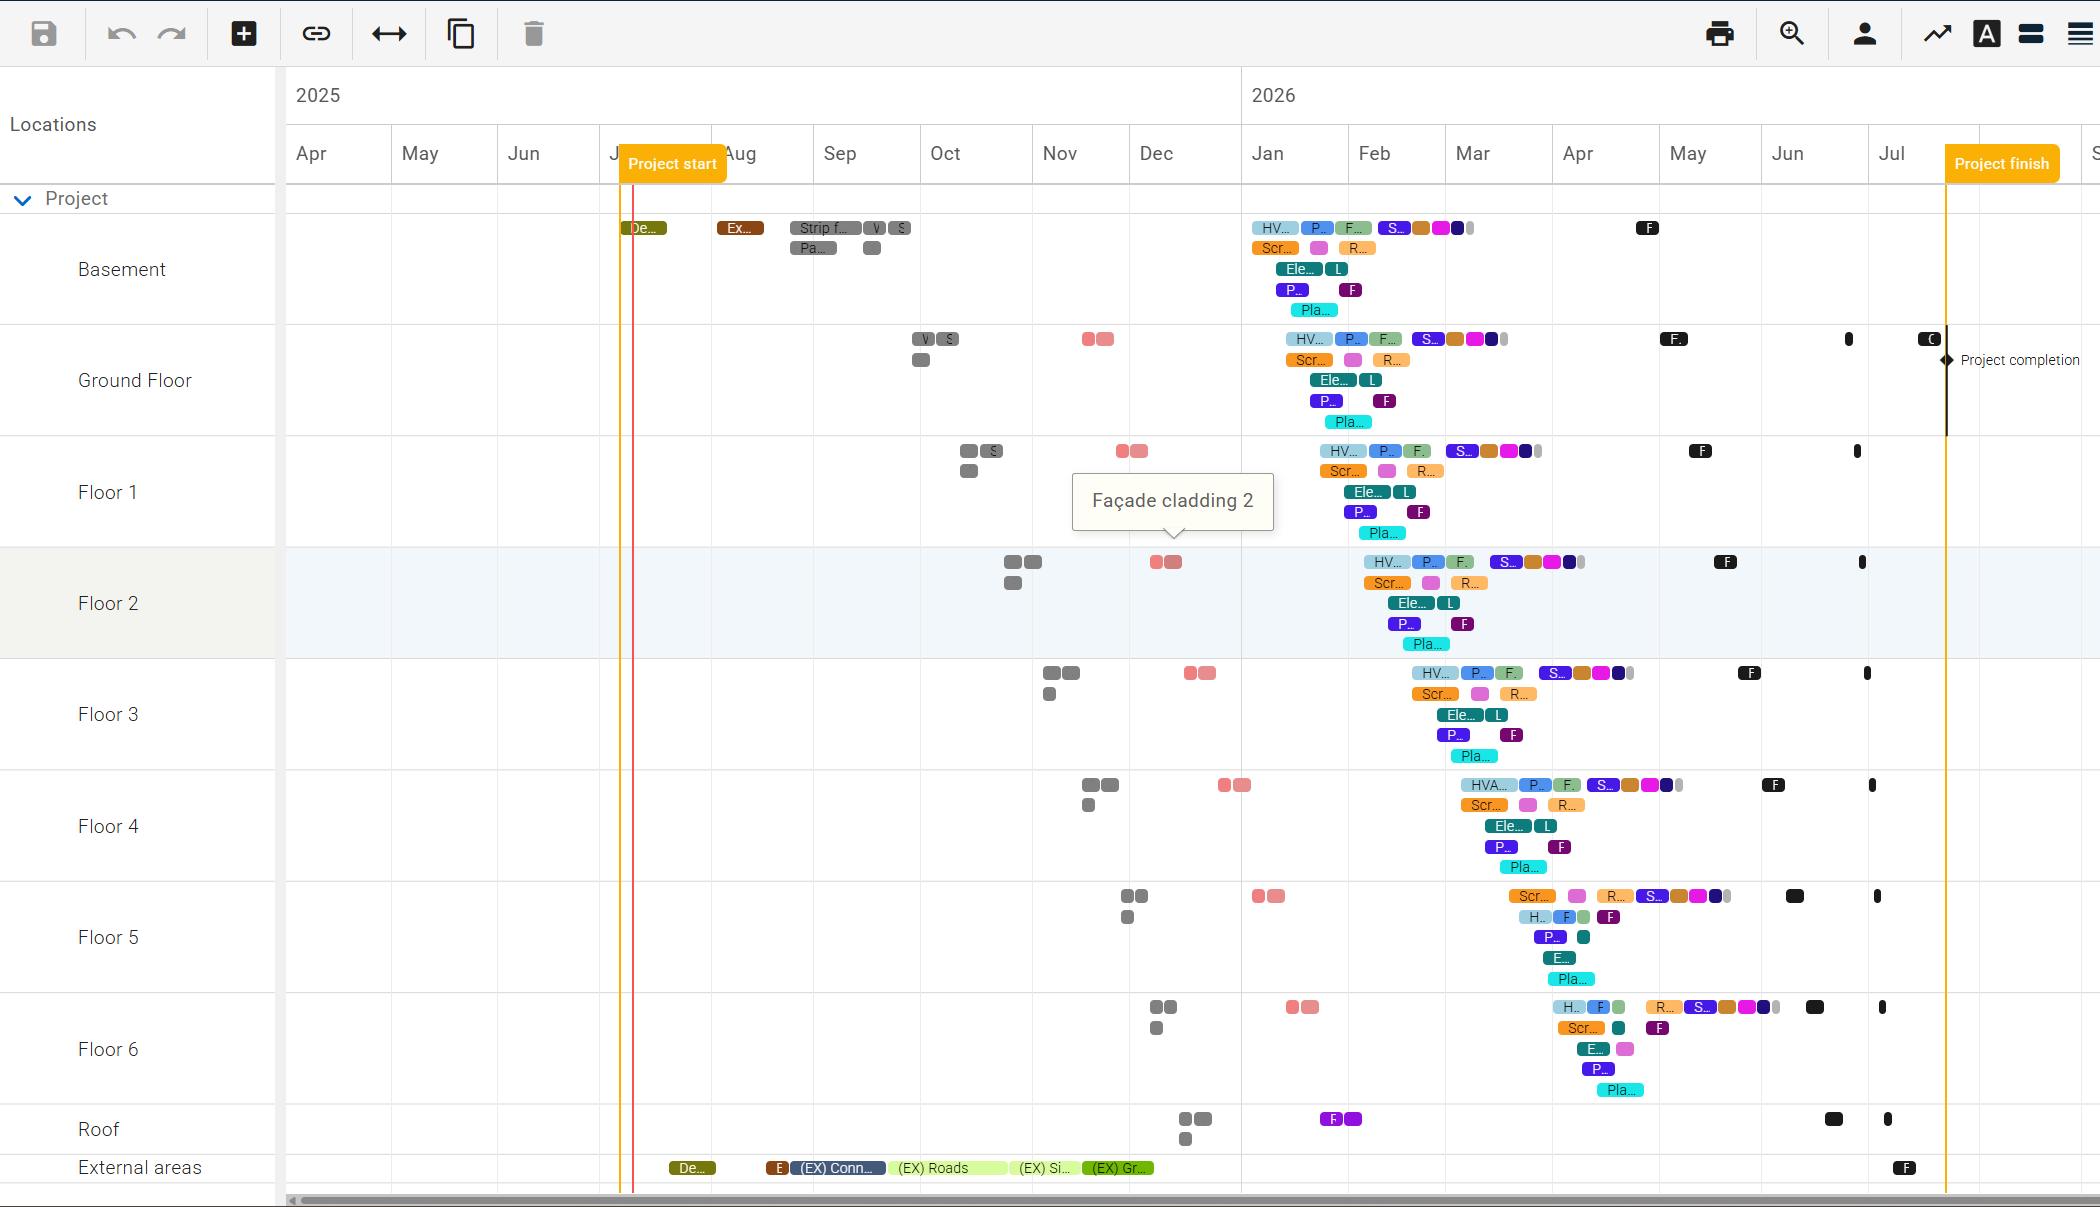
As you can see, the entire project fits on a single screen, allowing for a complete analysis of the rhythm and flow of work. Below, we see a close-up of the finishing works on the ground floor:
Because Tactplan groups tasks based on their location, it's much easier to assess whether the plan has been developed correctly. All conflicts, unproductive areas, and suboptimal start-stop sequences are immediately visible. In our case, the overall sequence is fairly sound, although there’s definitely room for optimization.
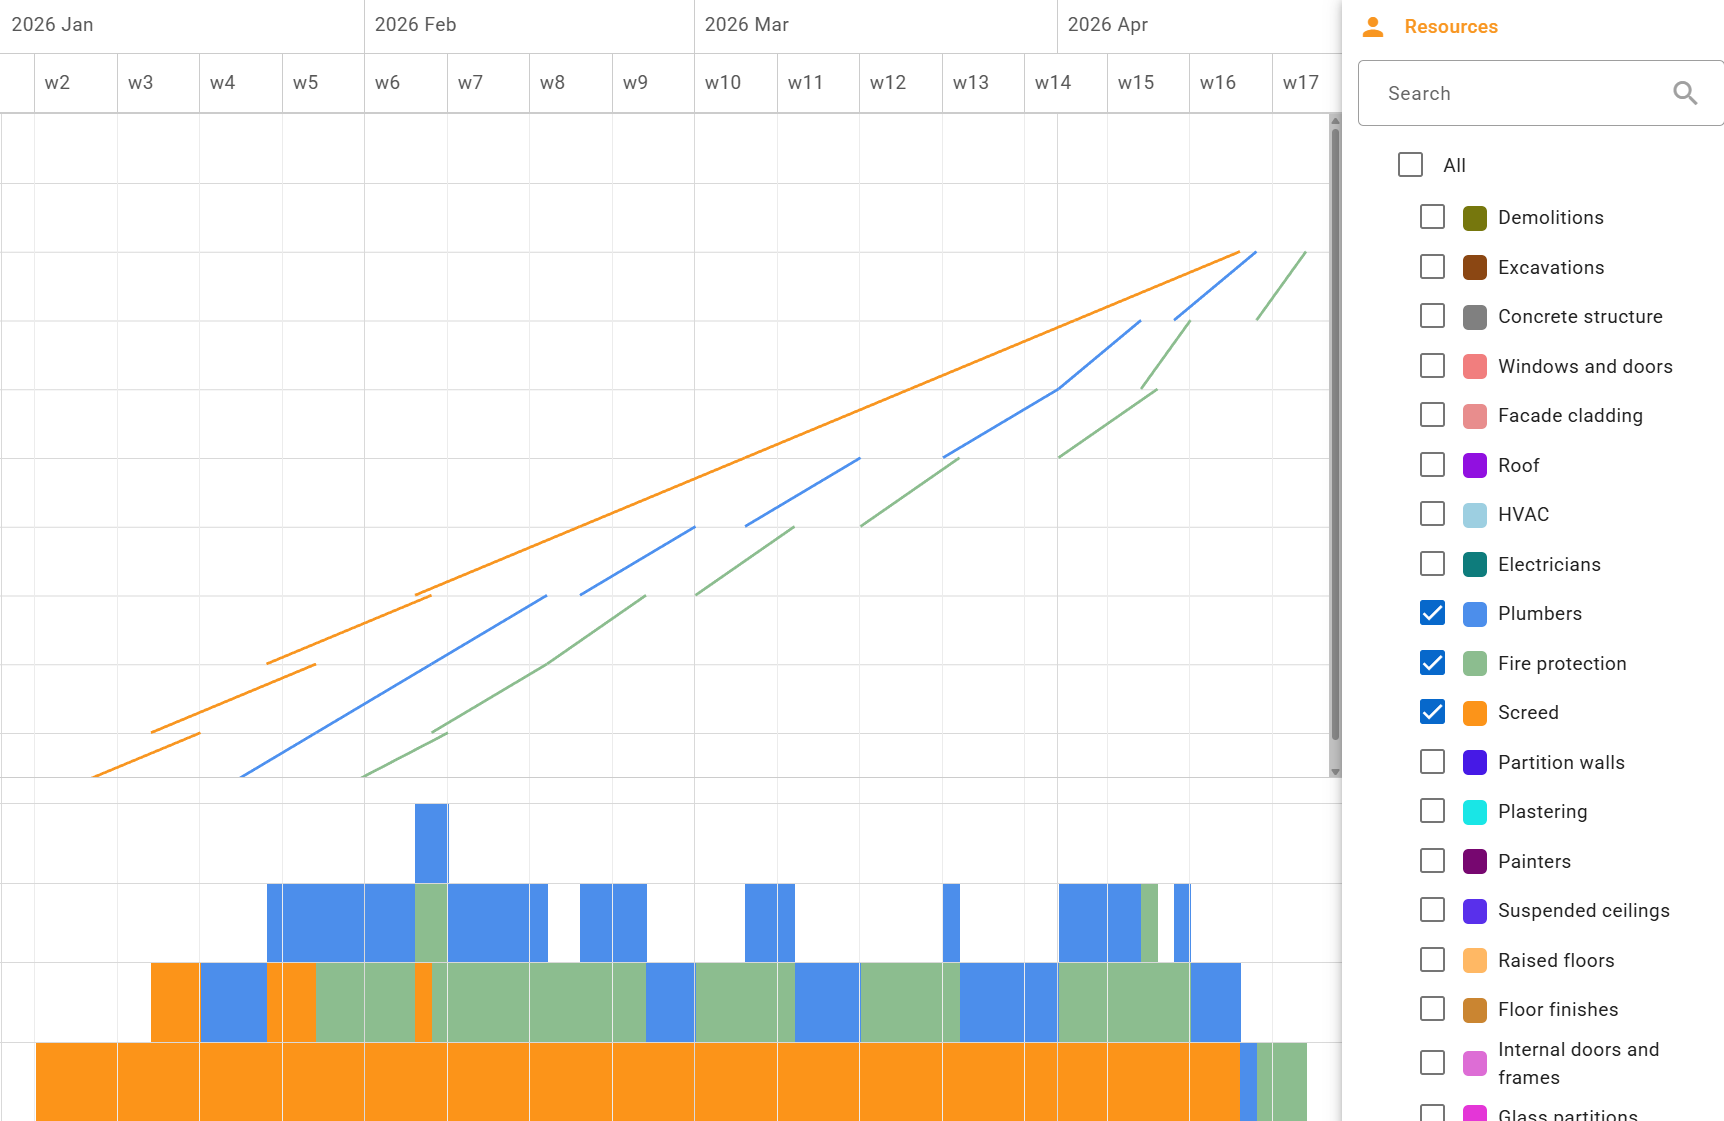
The resource load analysis leads to similar conclusions – the original plan is decent, but it could be better. Most resources are not distributed evenly, which may cause organizational issues, though it remains feasible to execute. Below is an example of resource load analysis across several trades:
When Small Changes Lead to Big Consequences
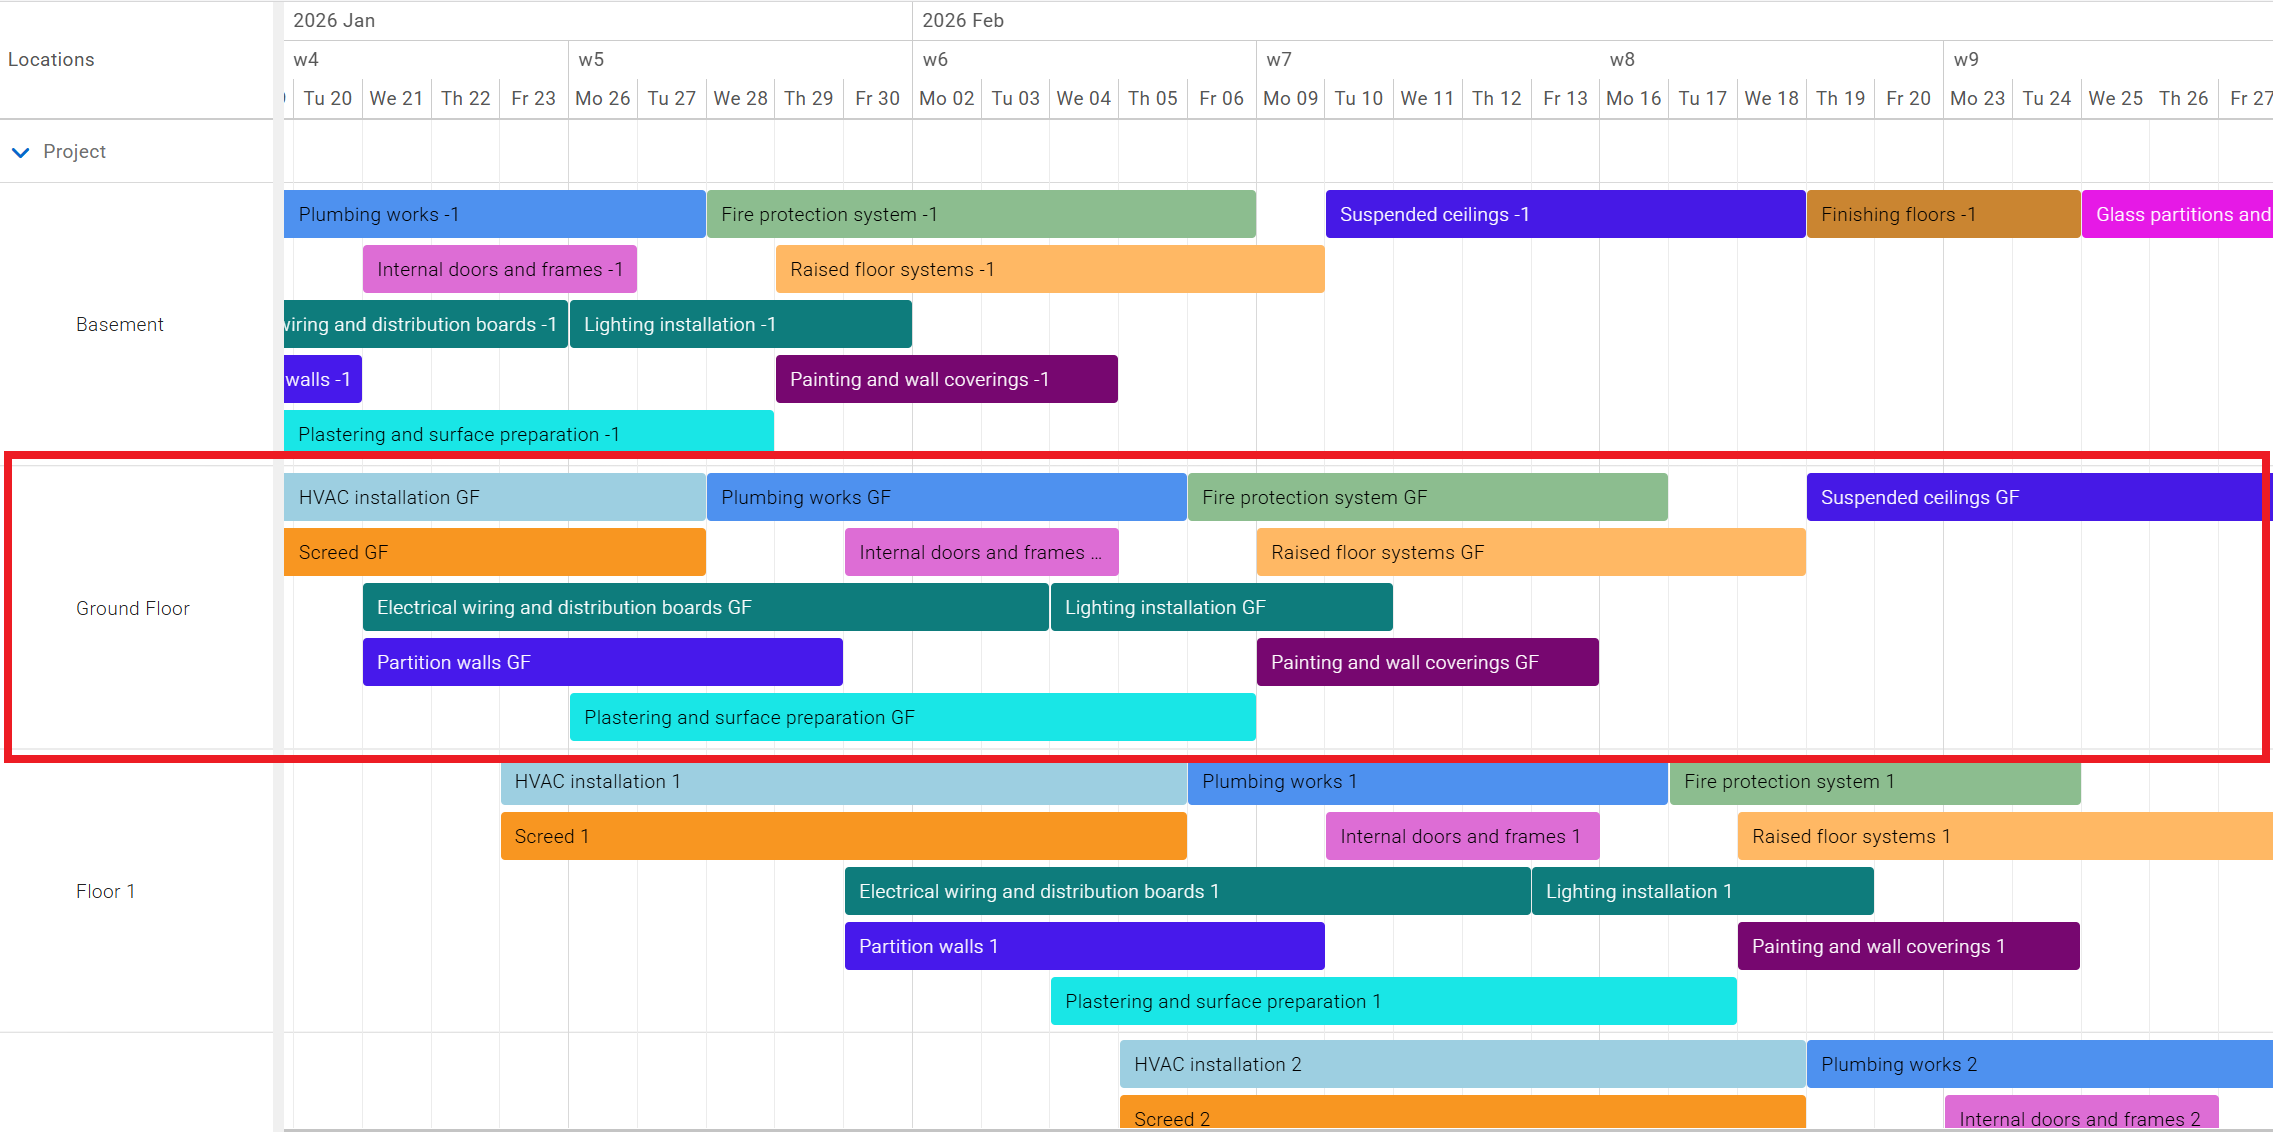
Let’s now try to apply the same changes that our scheduler made in the Gantt chart. Right away, we notice shifts in the sequence between finishing and installation works.
For example, cabling might not be installable before the partition walls are in place.
<Picture P_05>
Someone might argue that this is simply a matter of poorly defined dependencies, and that such issues can also be spotted in a Gantt chart. That’s absolutely true – our Gantt chart does reflect this as well. However, because the installation sequence is visually separated from the finishing works, it’s much harder to catch such conflicts.
It’s much easier to verify task relationships when they’re grouped in one place according to their location.
How Resource Load Charts Reveal Risks
However, that’s not the only issue in our case. When we look at the resource load charts, we notice some significant changes. It turns out that most of the companies working in this area will have to double the number of crews for several days in order to meet the new schedule. This is clearly visible in the charts below:
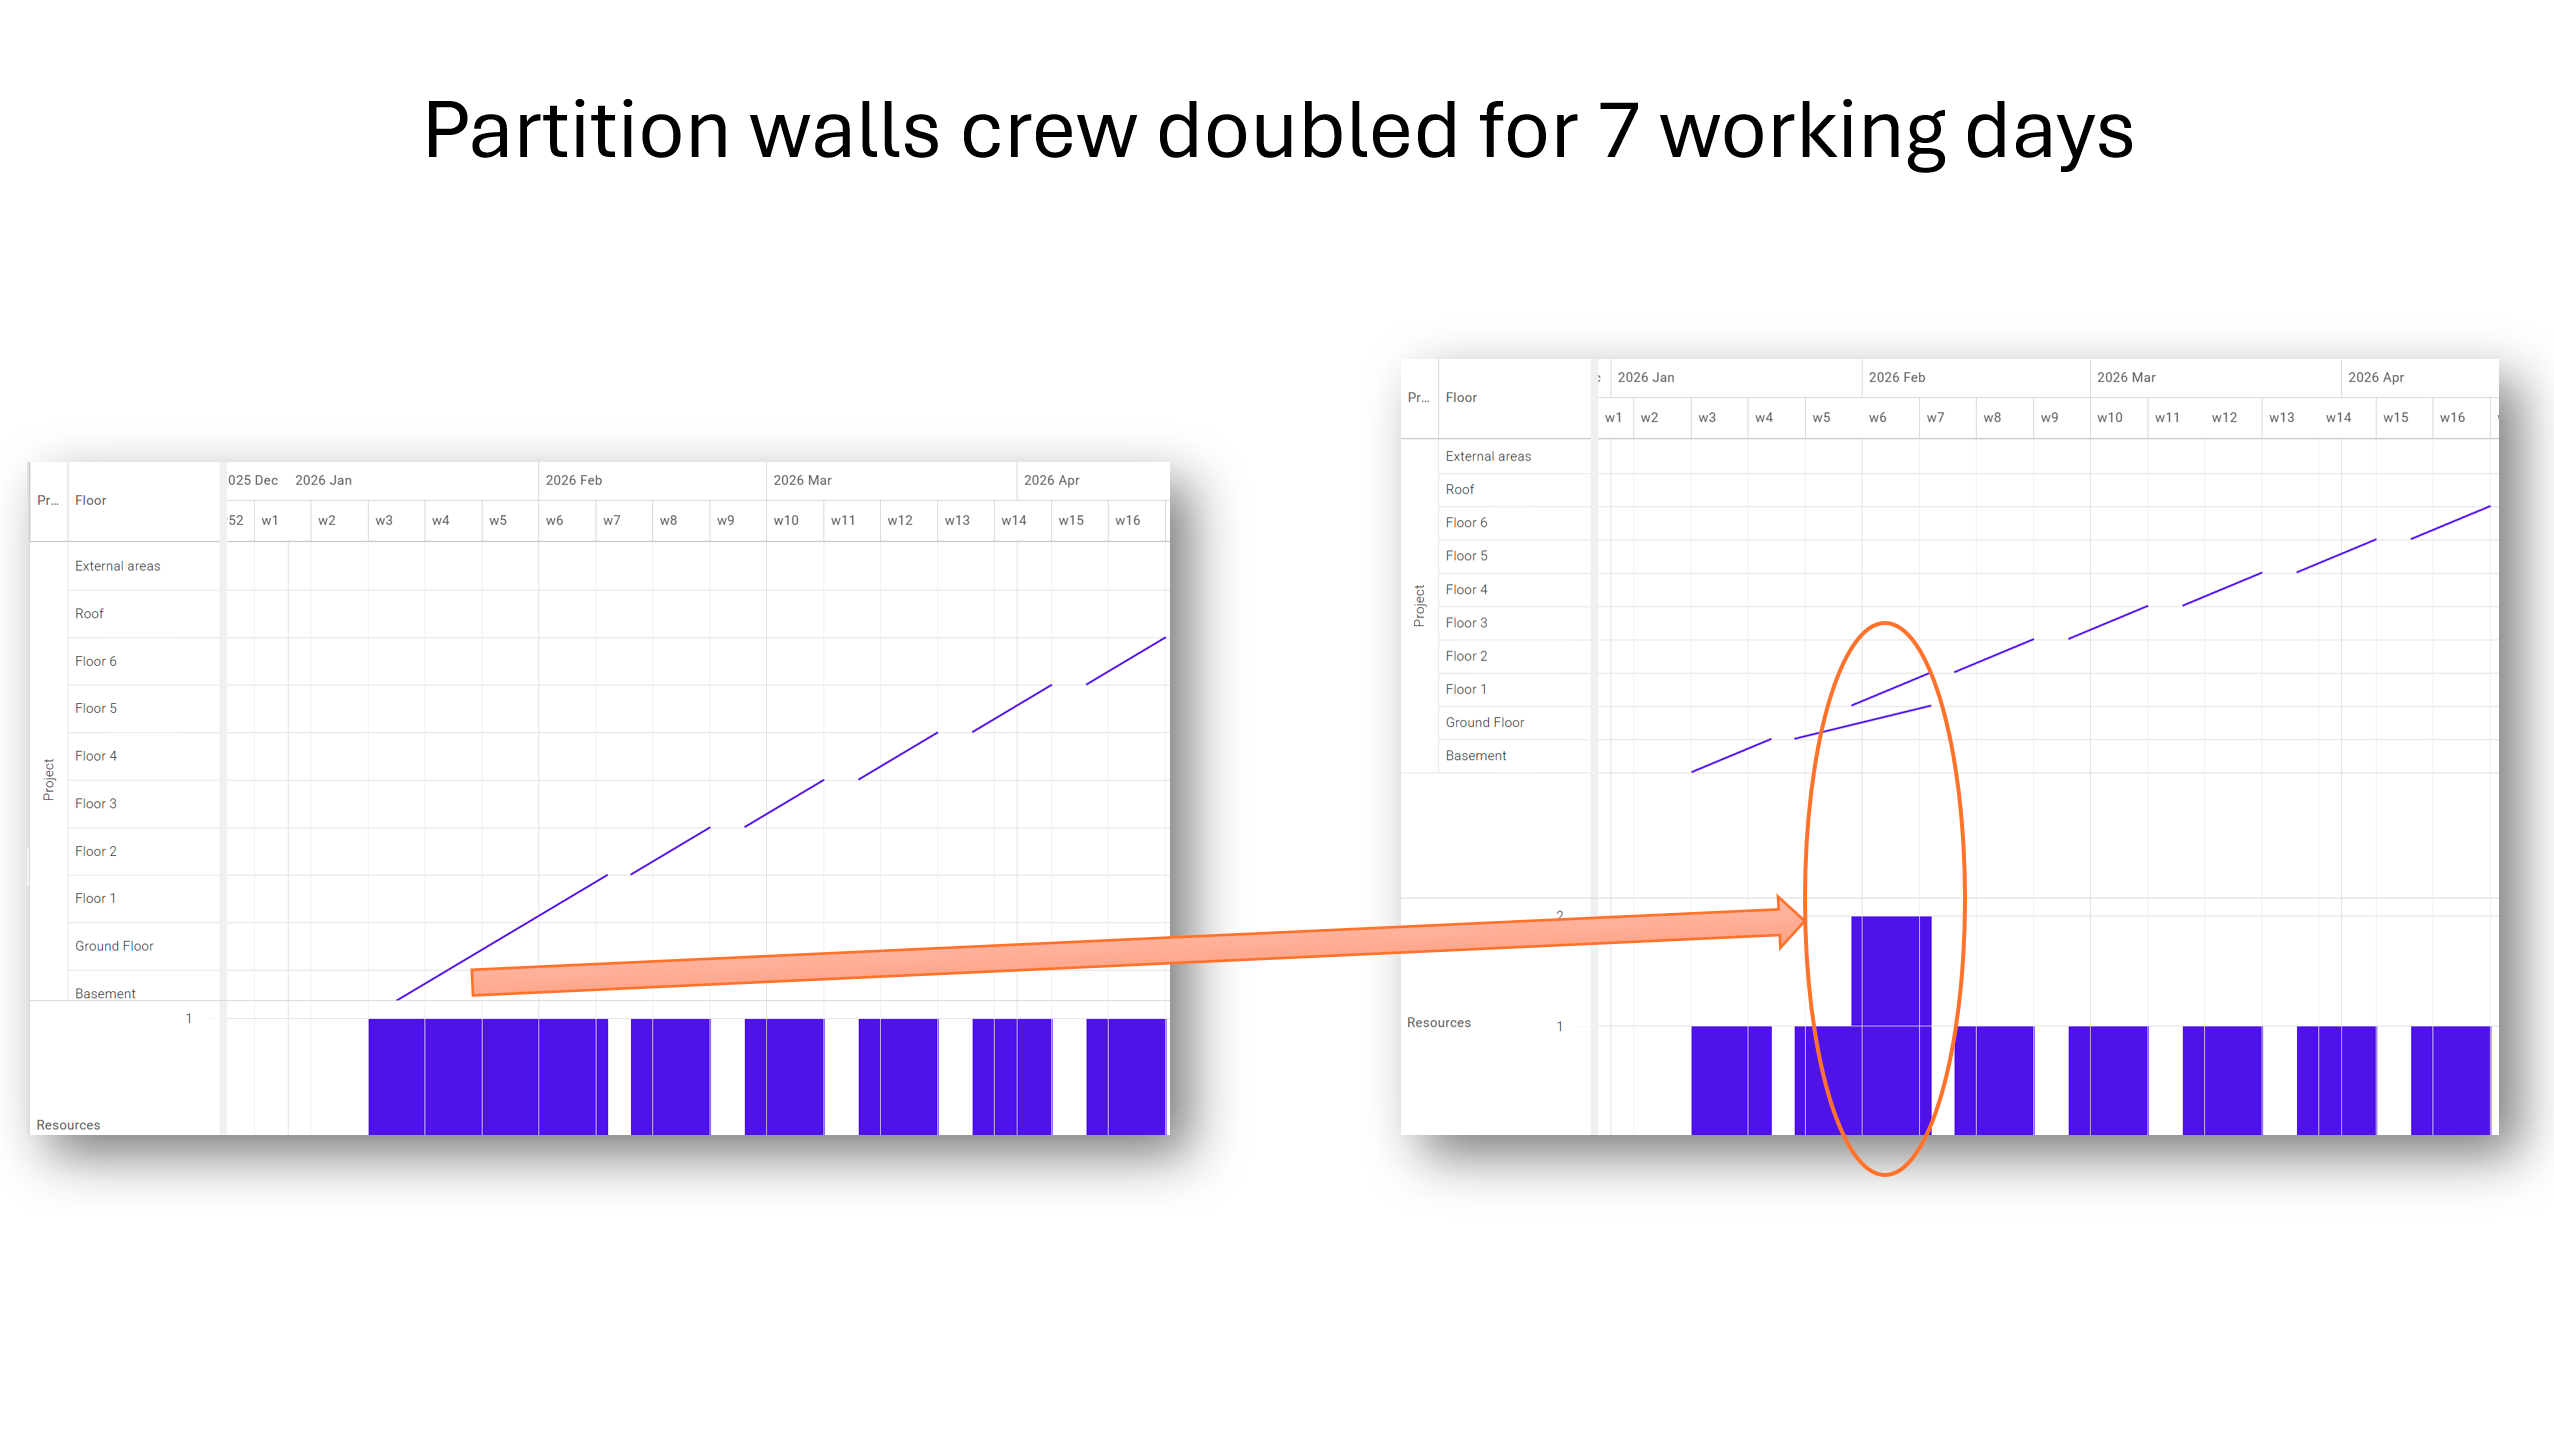
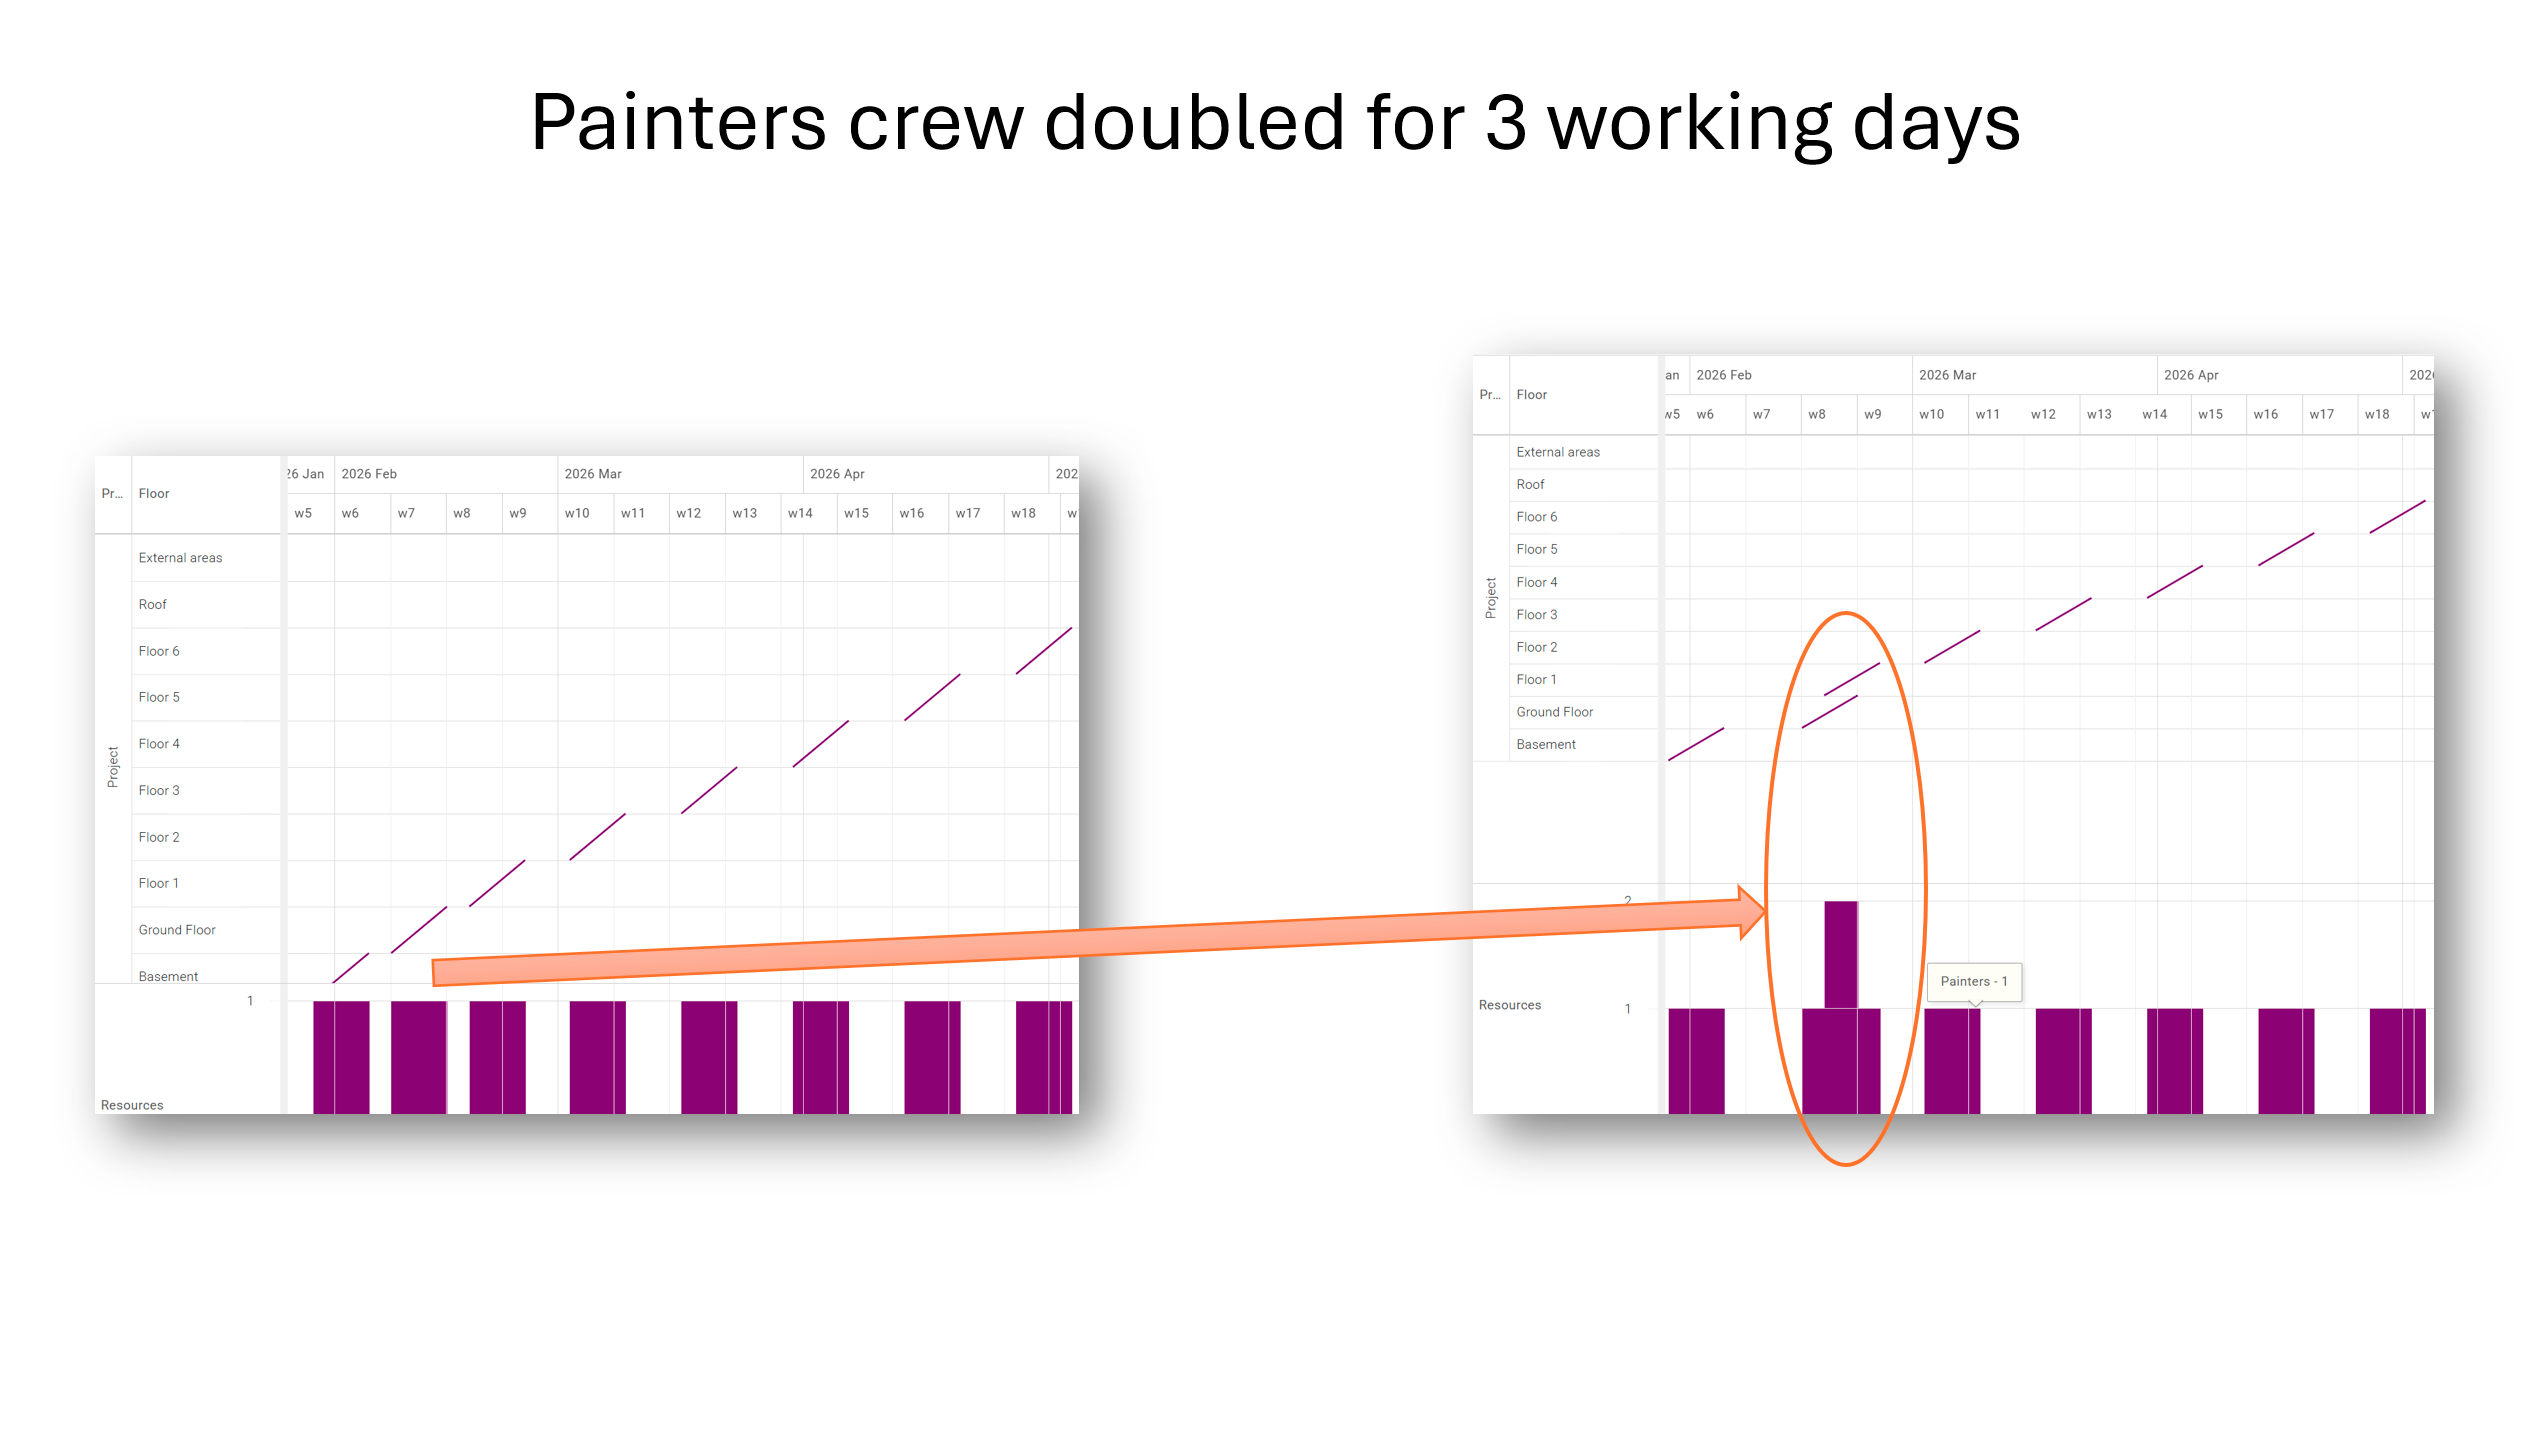
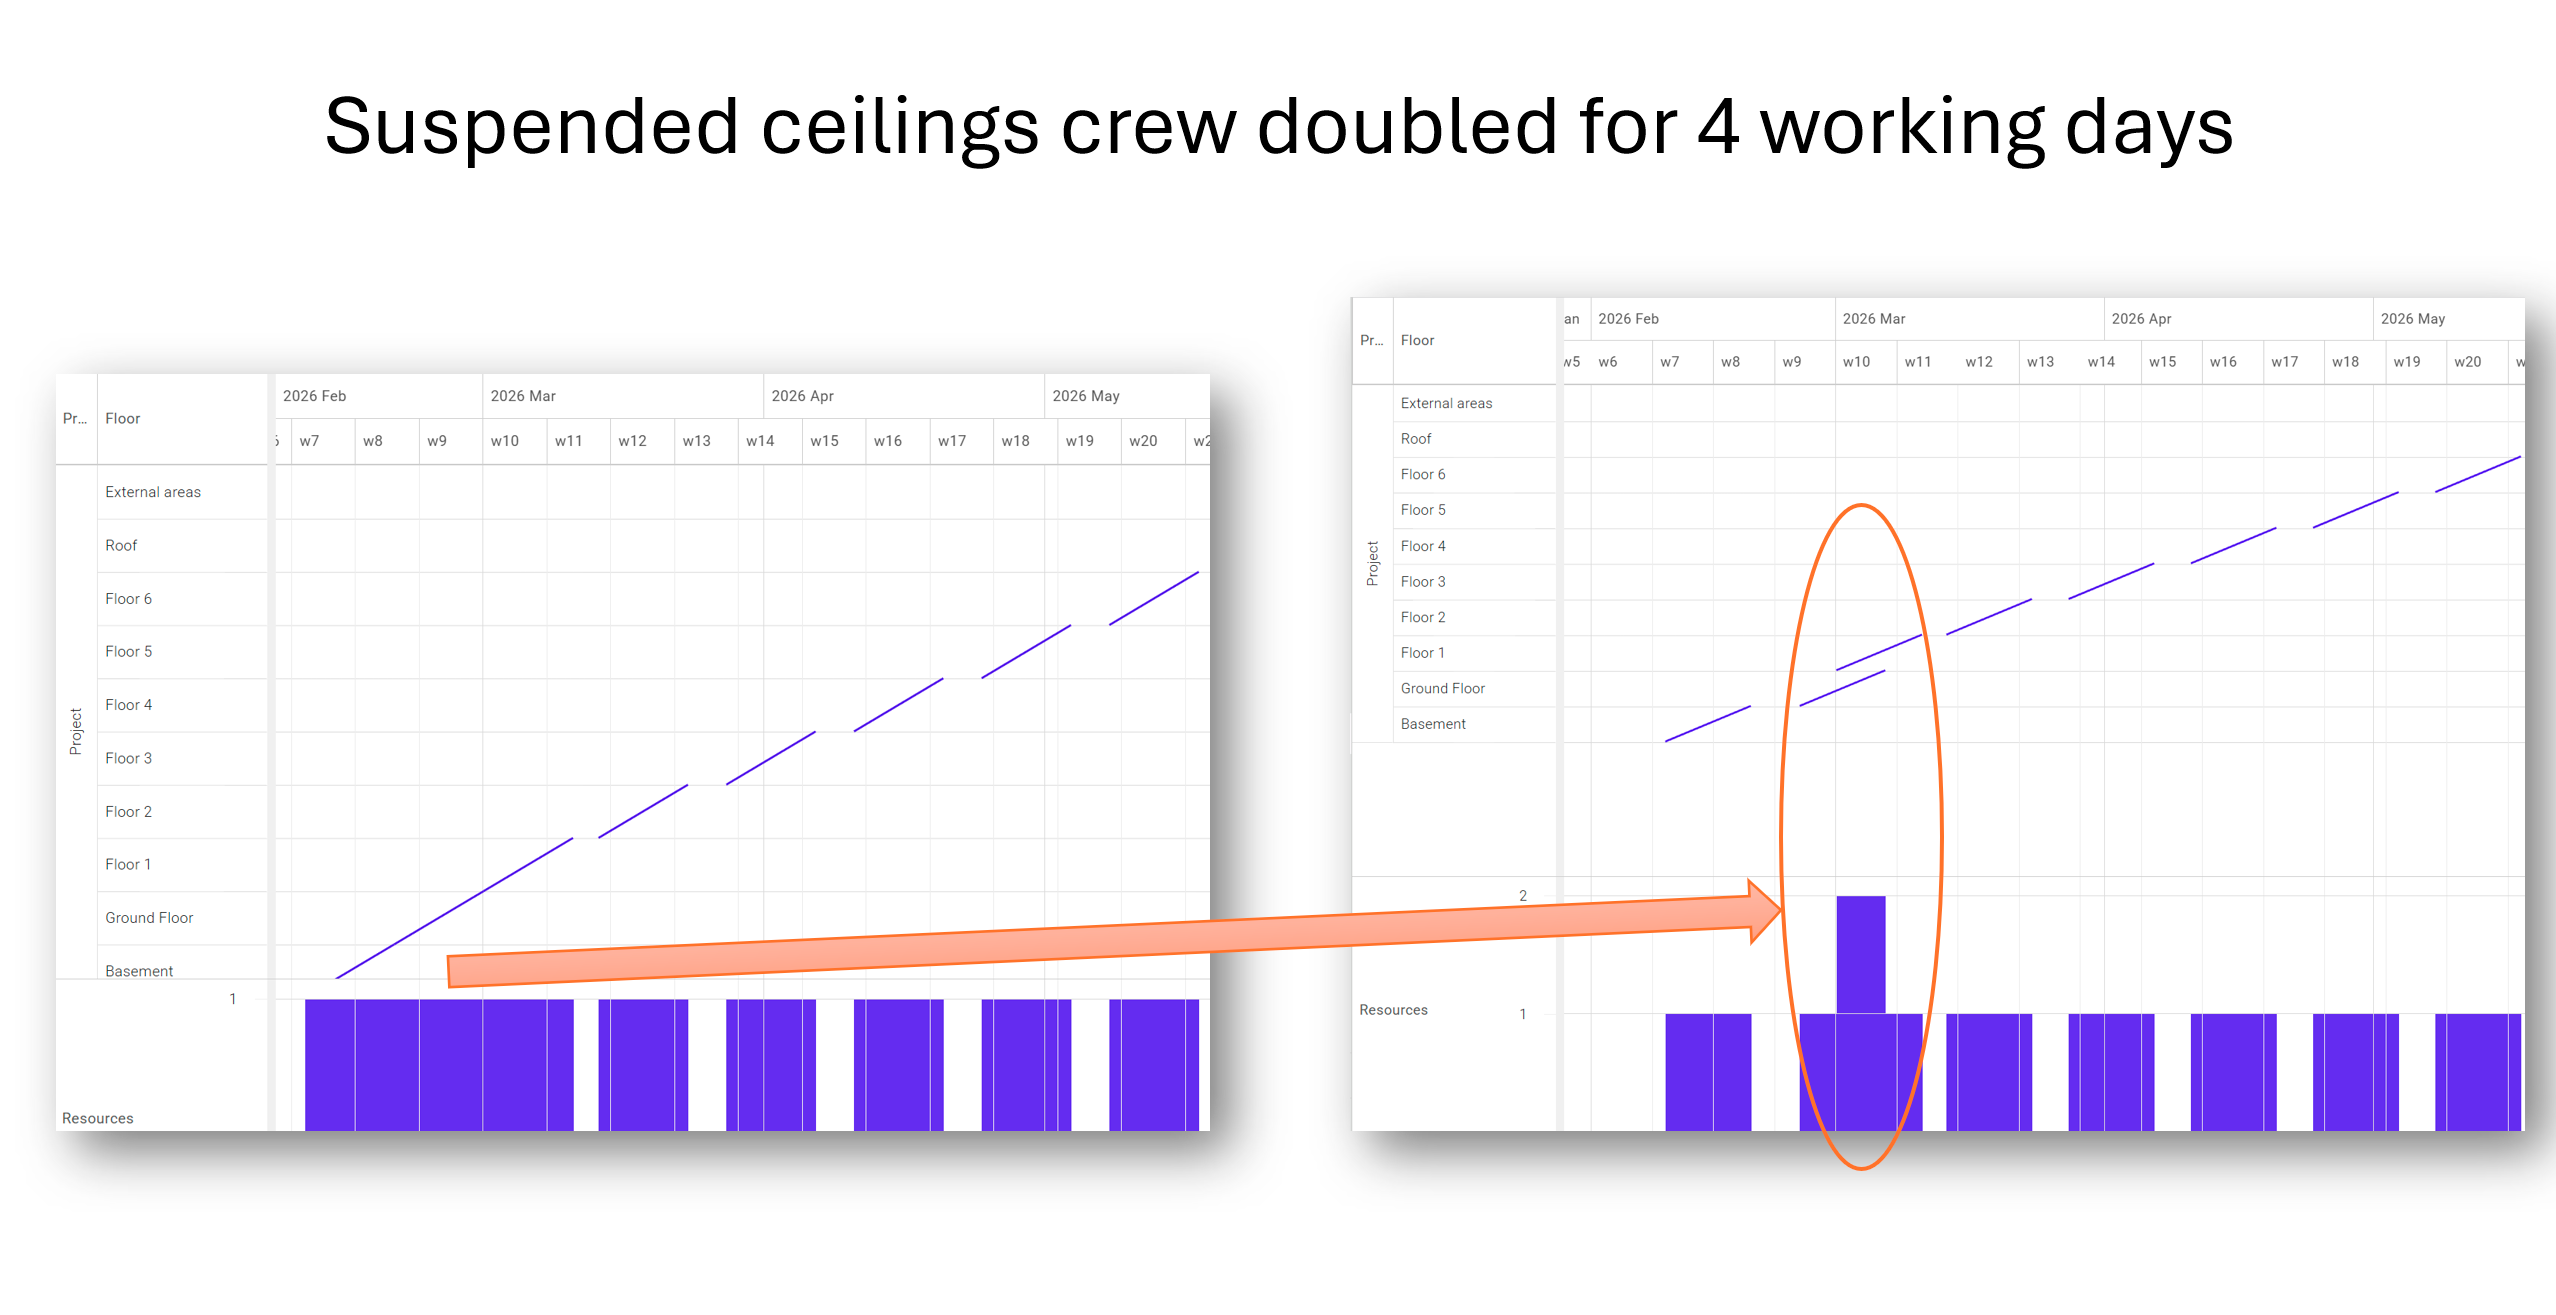
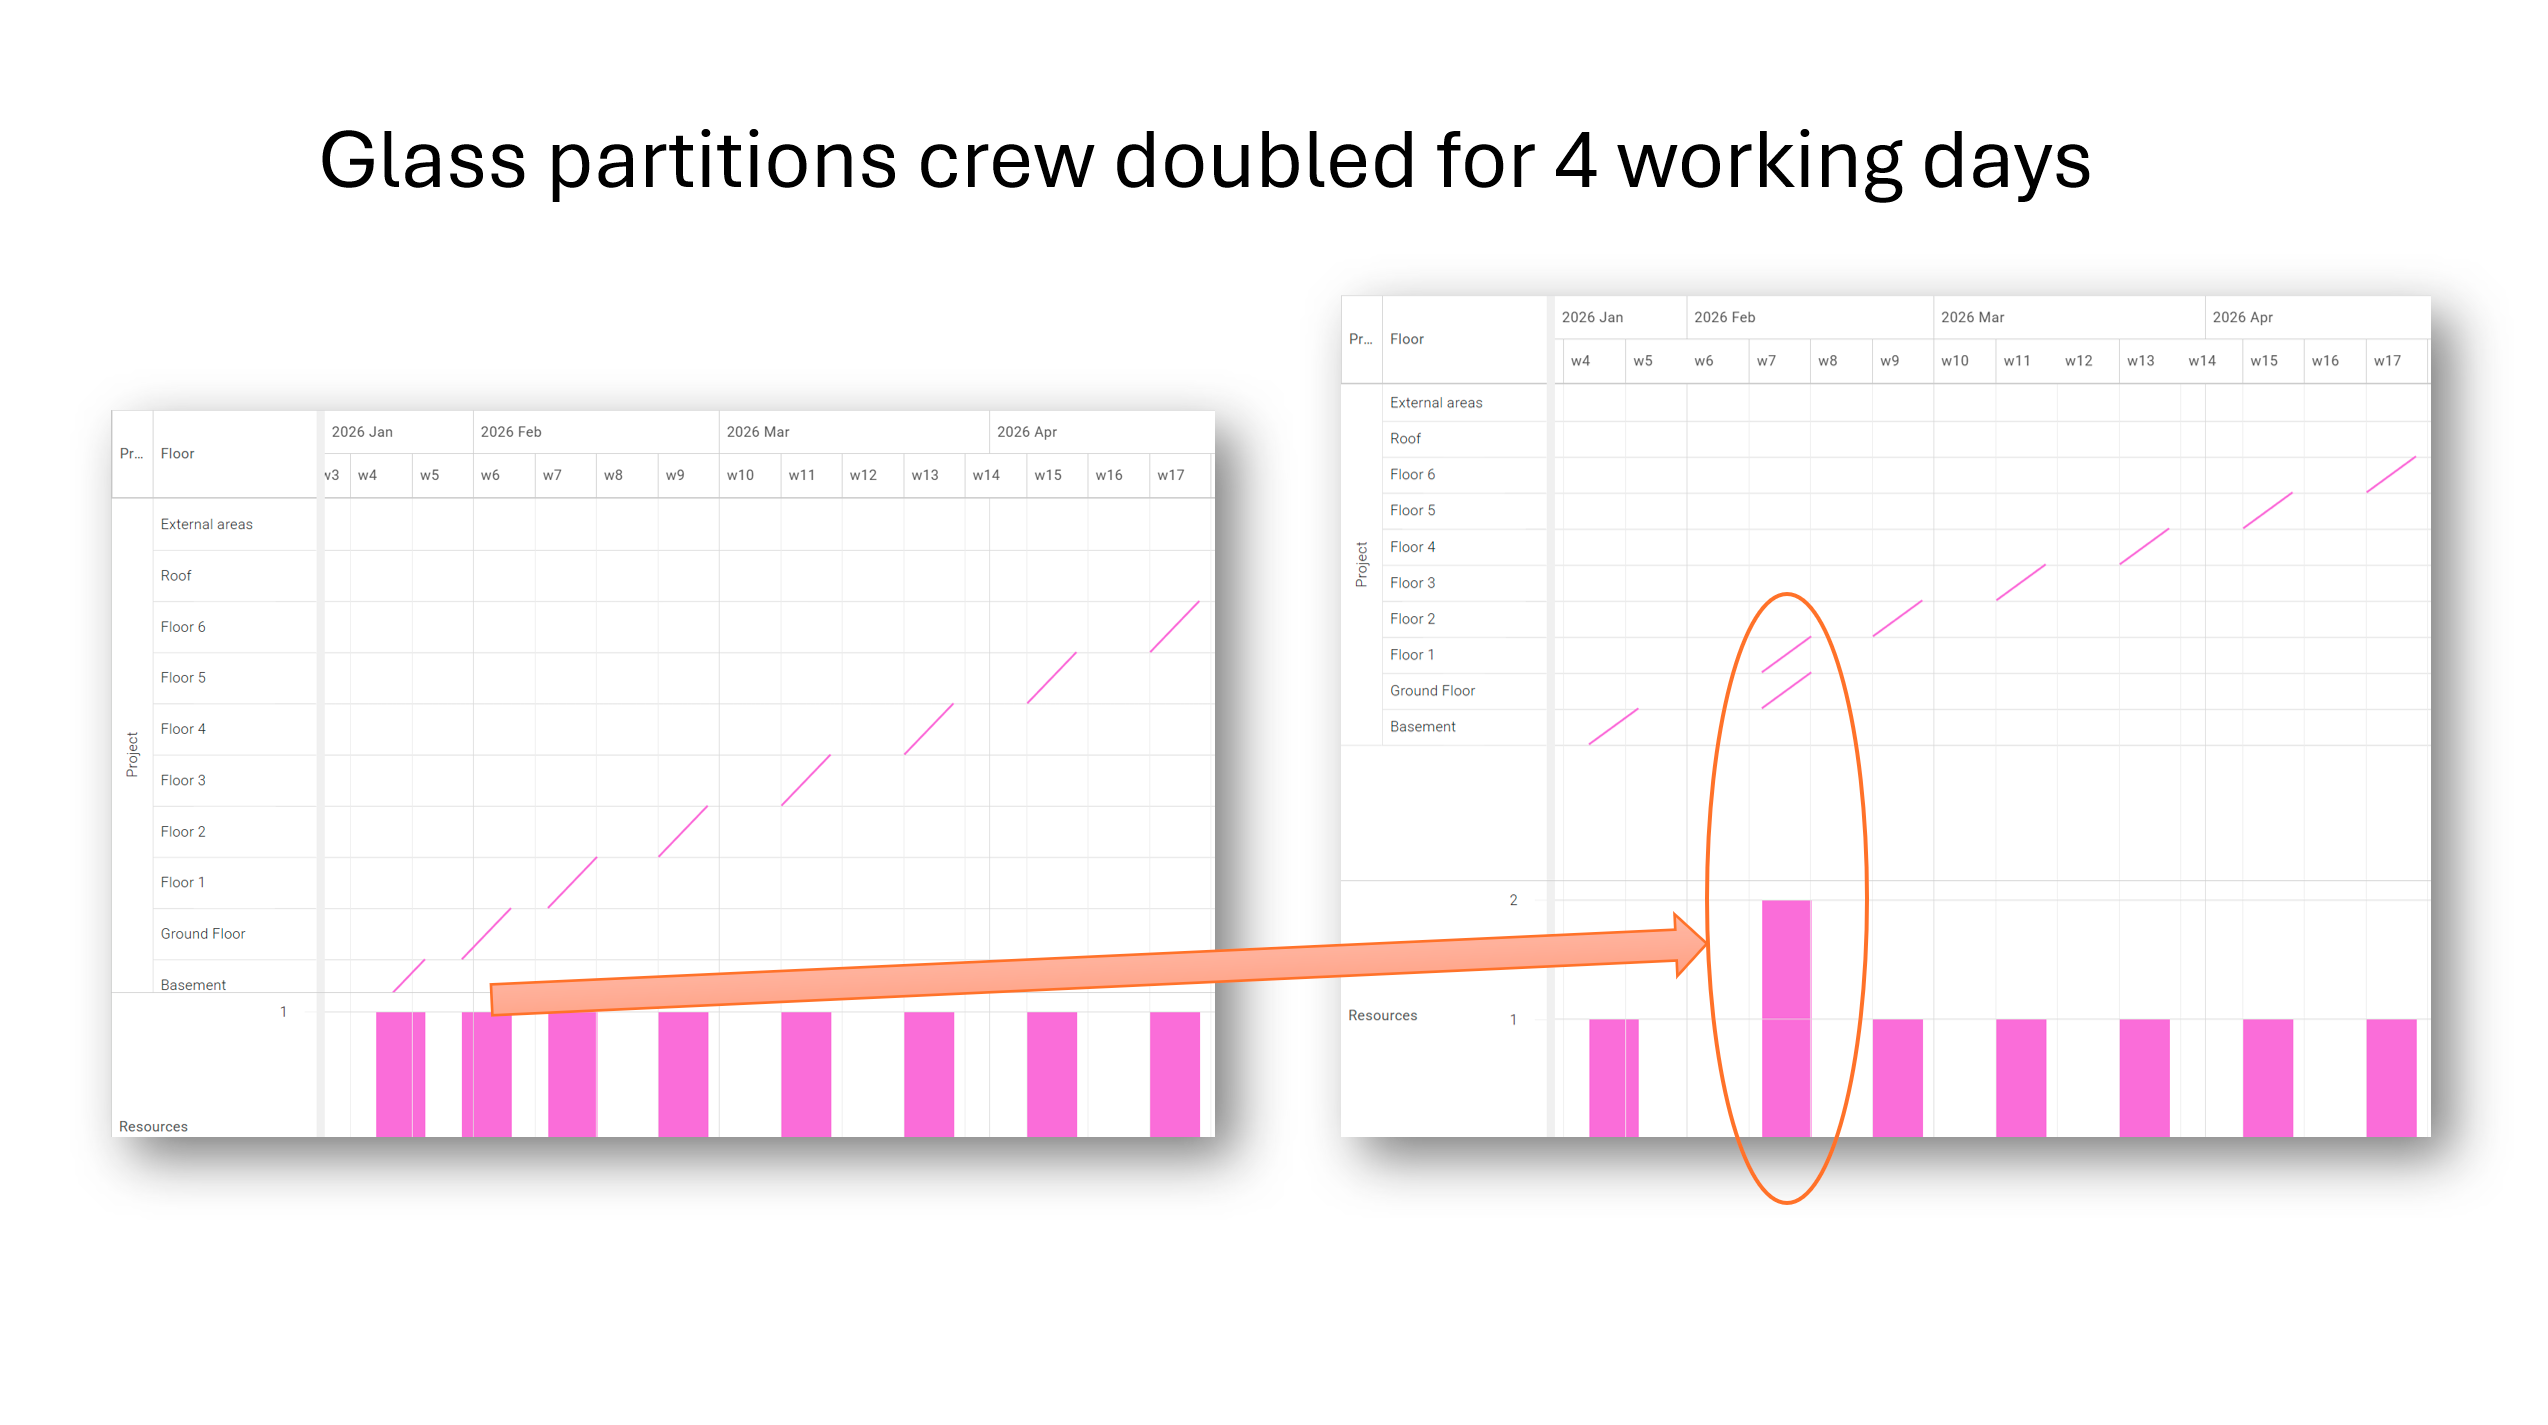
A sudden increase in the number of crews can be difficult to achieve, and if it doesn’t happen, the plan is likely to fall apart. This can lead to further organizational, financial, and contractual consequences.
Tactplan: Designed for the Real World of Construction Projects
In the example above, we analyzed a singlecase of a minor deviation from the original schedule. In real-life construction projects, such changes are frequent and often overlap with each other.
Without the right tools, it’s hard to foresee the potential impact of these changes or to develop an effective recovery plan.
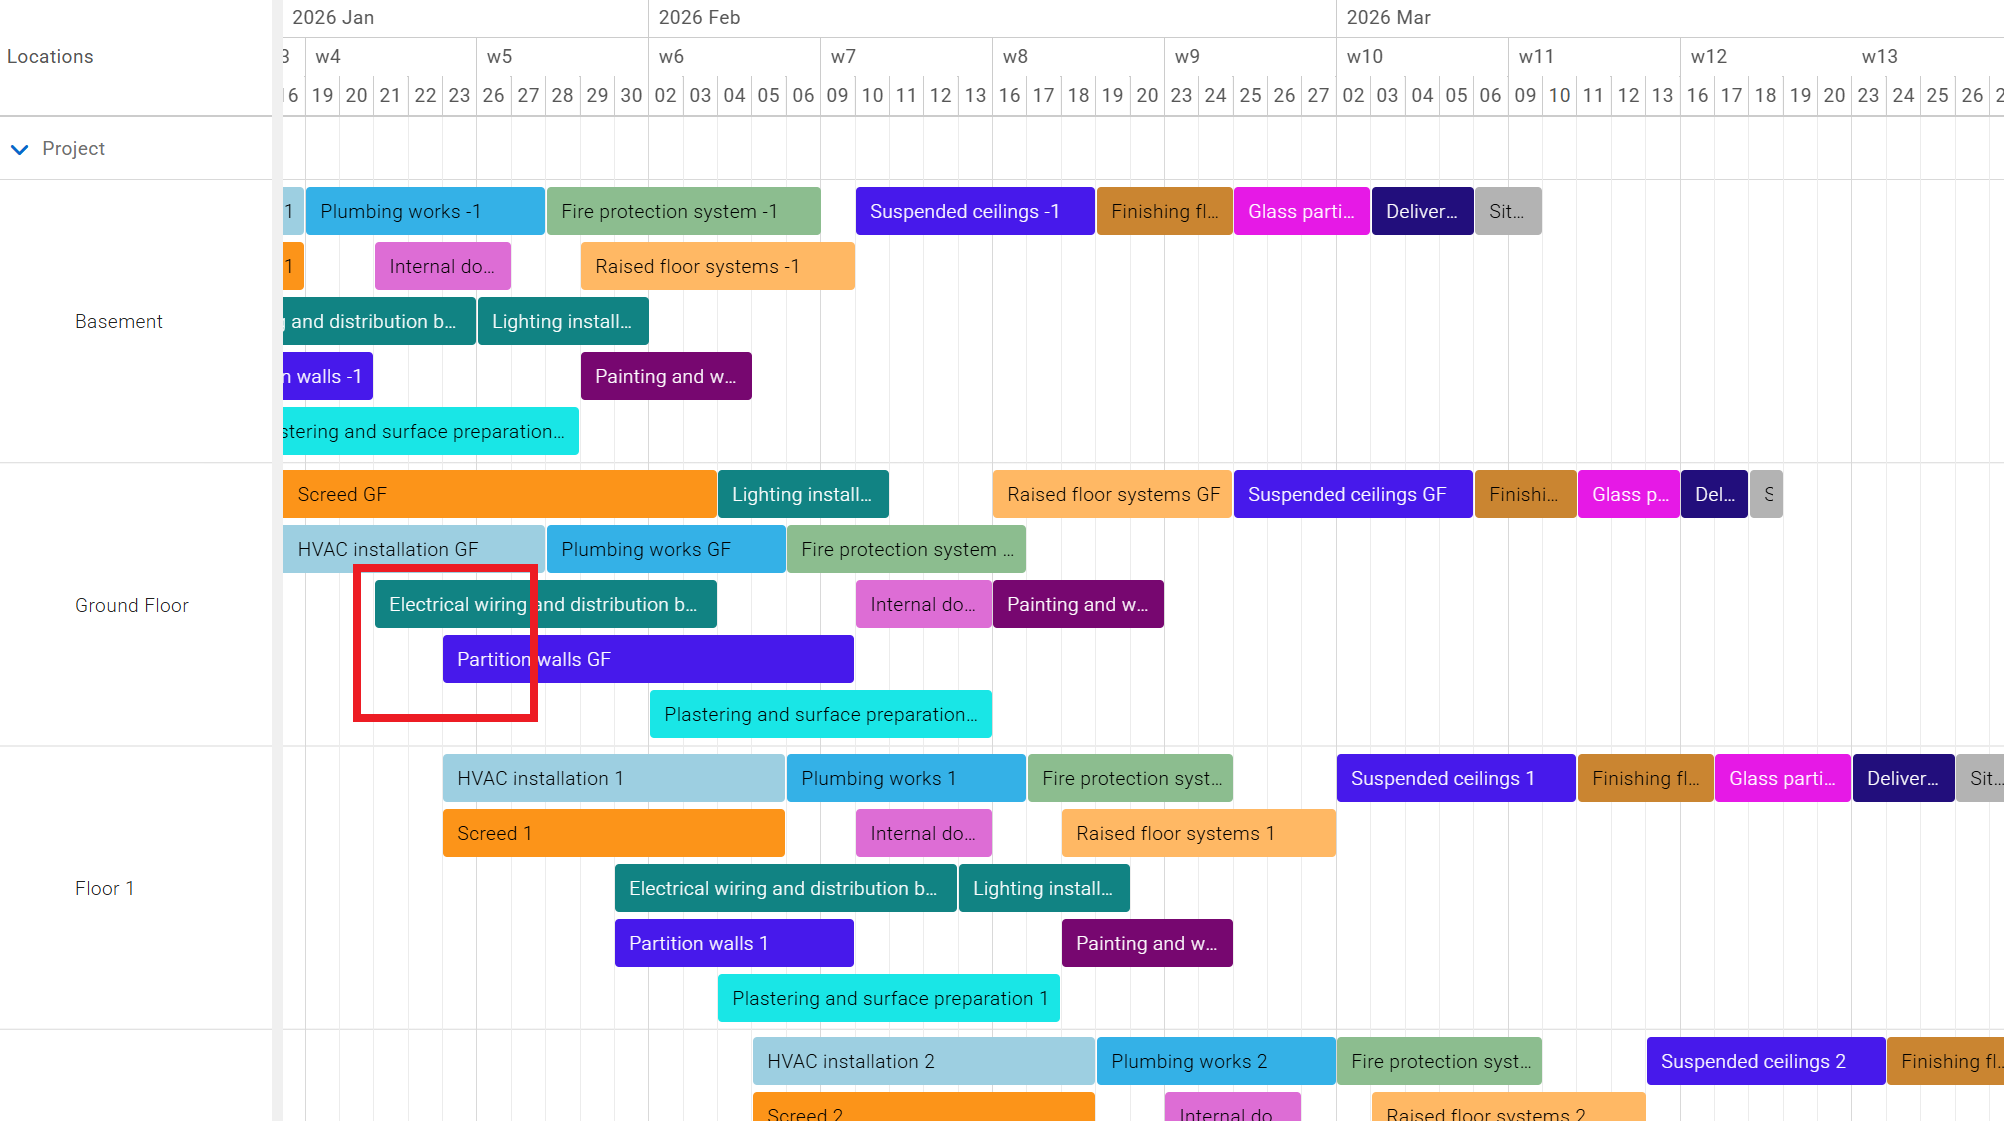
To conclude, below is the same schedule,not imported from the Gantt chart, but created from scratch in Tactplan. As you can see, the entire plan fits on a single page, and the parallel lines represent a smooth and consistent flow of work through each location. It’s also clear that the resource load chart is fluid and evenly distributed.
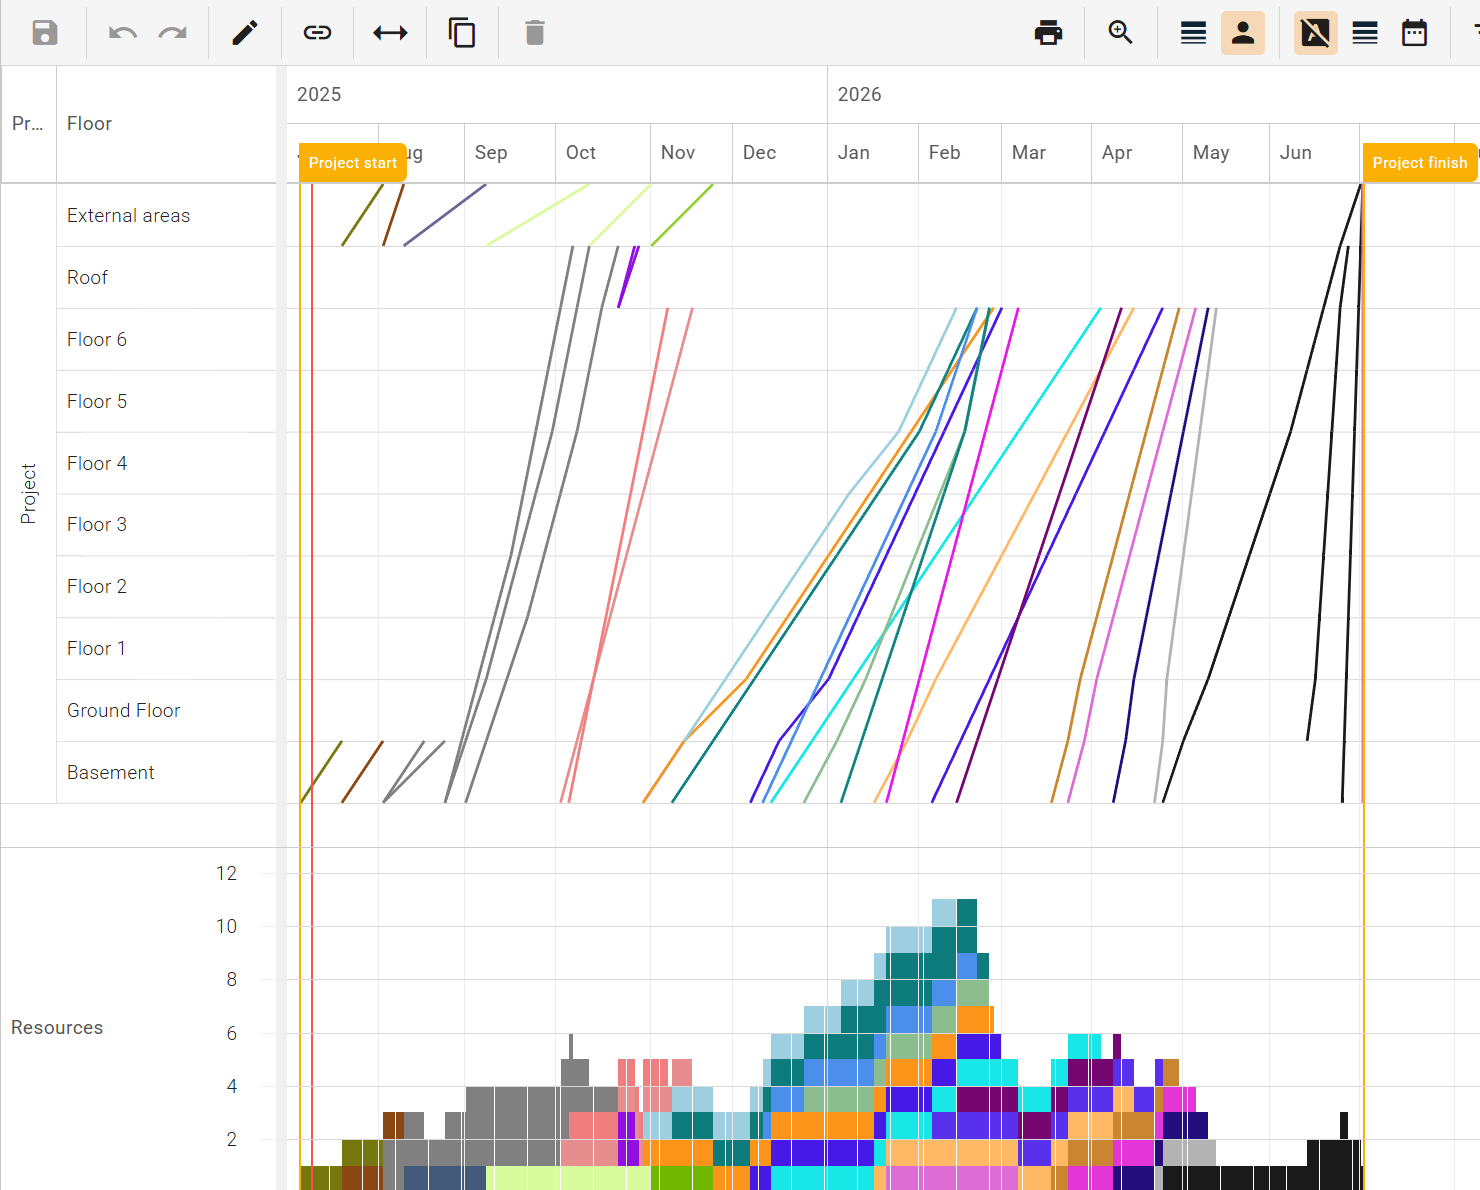
The above schedule hasn’t even been optimized yet – and it’s already three weeks shorter than the original! How can it be optimized further? That’s a topic for another article.
Do you want to learn more about location based scheduling? We provide a one-on-one introduction online. Please contact us.