.jpg)
Construction projects have always generated data – progress reports, budget tracking sheets, safety logs, quality inspections. But for decades, this information was stuck in filing cabinets and scattered spreadsheets, offering little value beyond basic record-keeping. The construction industry's traditional resistance to change meant that while other sectors embraced data analytics to drive innovation, construction lagged behind.
That's changing. Today's construction firms face increasing pressure to deliver projects faster, cheaper, and with higher quality than ever before. According to McKinsey Global Institute research, construction productivity construction productivity is stuck in stagnation for decades while other industries have seen substantial gains. The solution lies not in working harder, but in working smarter through systematic data analysis.
Construction data analysis represents a fundamental shift from intuition-based management to evidence-driven decision-making. When project teams systematically collect, analyze, and act on project data, they transform reactive firefighting into proactive problem prevention. This guide explores how construction data analysis works, its tangible benefits, and practical strategies for implementation.
What is Construction Data Analysis?
Before diving into methodologies and benefits, understanding exactly what construction data analysis entails provides the foundation for effective implementation.
Construction data analysis is the systematic process of collecting, processing, and interpreting project information to generate actionable insights that improve decision-making, optimize resource allocation, and enhance project outcomes.
Definition: Construction data analysis involves examining diverse data sources – including schedules, costs, productivity rates, quality metrics, and safety records – using statistical methods and analytical tools to identify patterns, predict future performance, and guide strategic decisions.
Unlike traditional project reporting that simply documents what happened, data analysis reveals why it happened and what will likely happen next. This predictive capability transforms project management from reactive crisis response to proactive risk mitigation.
Effective construction data analysis addresses multiple project dimensions simultaneously. Schedule analysis identifies activities most likely to cause delays. Cost analysis reveals which elements consistently overrun budgets. Productivity analysis shows which crews or methods deliver best results. Quality analysis pinpoints systematic defect patterns. Safety analysis highlights risk factors before accidents occur.
The most sophisticated construction firms integrate these analytical dimensions, understanding that project performance results from complex interactions between schedule, cost, resources, and quality. This holistic approach delivers insights impossible to achieve through isolated analysis of individual metrics – which explains why data analysis has become essential rather than optional.
Why Data Analysis is Essential in Construction
Understanding what data analysis is naturally leads to the question of why it matters so critically in today's construction environment.
The construction industry's complexity demands analytical rigor. Projects involve hundreds of interconnected activities, dozens of subcontractors, thousands of material deliveries, and countless decision points. Traditional management approaches that rely on experience and intuition cannot process this complexity effectively.
Competitive Pressure
Construction markets reward firms that consistently deliver projects on time and within budget. According to the Construction Industry Institute, contractors using systematic data analysis achieve 15-20% better schedule performance and 10-15% better cost performance compared to those using traditional management methods.
Risk Mitigation
Construction projects face numerous risks – weather delays, material shortages, labor availability, design changes, regulatory requirements. Data analysis enables probabilistic risk assessment that quantifies likely impacts and supports evidence-based contingency planning.
Resource Optimization
Labor, equipment, and materials represent major project costs. Data analysis reveals optimization opportunities that traditional management misses – identifying underutilized equipment, highlighting inefficient work sequences, and predicting material needs with greater accuracy.
Continuous Improvement
Projects provide rich learning opportunities, but only if firms systematically capture and analyze performance data. Construction companies using data analytics build institutional knowledge that compounds over time, as each project teaches lessons applied to future work.
These compelling reasons establish why data analysis matters, but understanding how it actually works in practice enables effective implementation.
How Construction Data Analysis Works
Construction data analysis follows a systematic process that transforms raw information into actionable intelligence. This process has two primary phases: collection and analysis.
Data Collection from Multiple Sources
Modern construction projects generate data from diverse sources, each providing unique insights into project performance:
Project Schedules
Digital scheduling systems track planned versus actual progress, revealing schedule variances and productivity trends. Location-based scheduling platforms provide spatial data showing where work occurs across construction zones, enabling analysis impossible with traditional Gantt charts.
Budget and Cost Data
Financial systems capture actual costs at various levels of detail – from individual purchase orders to summary cost reports. Integrating cost data with schedule information enables earned value analysis that reveals true project performance.
Resource Allocation
Labor timesheets, equipment logs, and material delivery records document resource deployment. Analyzing this data against completed work quantities reveals productivity rates and identifies optimization opportunities.
Quality Inspections
Inspection reports, punch lists, and defect logs provide quantifiable quality data. Tracking defect patterns by location, trade, or work type highlights systematic quality issues requiring process improvements.
Safety Records
Incident reports, near-miss documentation, and safety audit findings create measurable safety performance data. Analyzing safety information identifies risk factors and validates whether safety investments deliver expected benefits.
Environmental Data
Weather conditions, temperature fluctuations, and site conditions affect construction productivity. Recording environmental data alongside performance metrics enables weather-adjusted productivity analysis.
Analyzing and Interpreting Construction Data
Collection alone provides no value – the power of data emerges through systematic analysis that transforms information into insights.
Modern construction analytics employs multiple techniques:
Trend Analysis
Examining performance patterns over time reveals whether projects improve, deteriorate, or remain stable. Schedule performance trending predicts future completion dates based on current velocity. Cost trending forecasts final project costs based on burn rates.
Variance Analysis
Comparing actual performance against plans identifies specific activities or cost elements requiring attention. Location-based variance analysis shows which building areas perform well and which need intervention.
Correlation Analysis
Examining relationships between variables reveals causal factors. For example, analyzing crew size versus productivity might reveal optimal team configurations. Studying weather conditions versus output rates quantifies weather impacts.
Benchmark Comparisons
Comparing project performance against historical data or industry standards provides context for current results. Benchmark analysis reveals whether problems reflect project-specific issues or systemic organizational challenges.
Modern construction management platforms automate much of this analysis, continuously processing data and highlighting exceptions that require management attention. This automation enables real-time analytics that traditional manual analysis cannot match, delivering the tangible benefits that justify analytical investments.
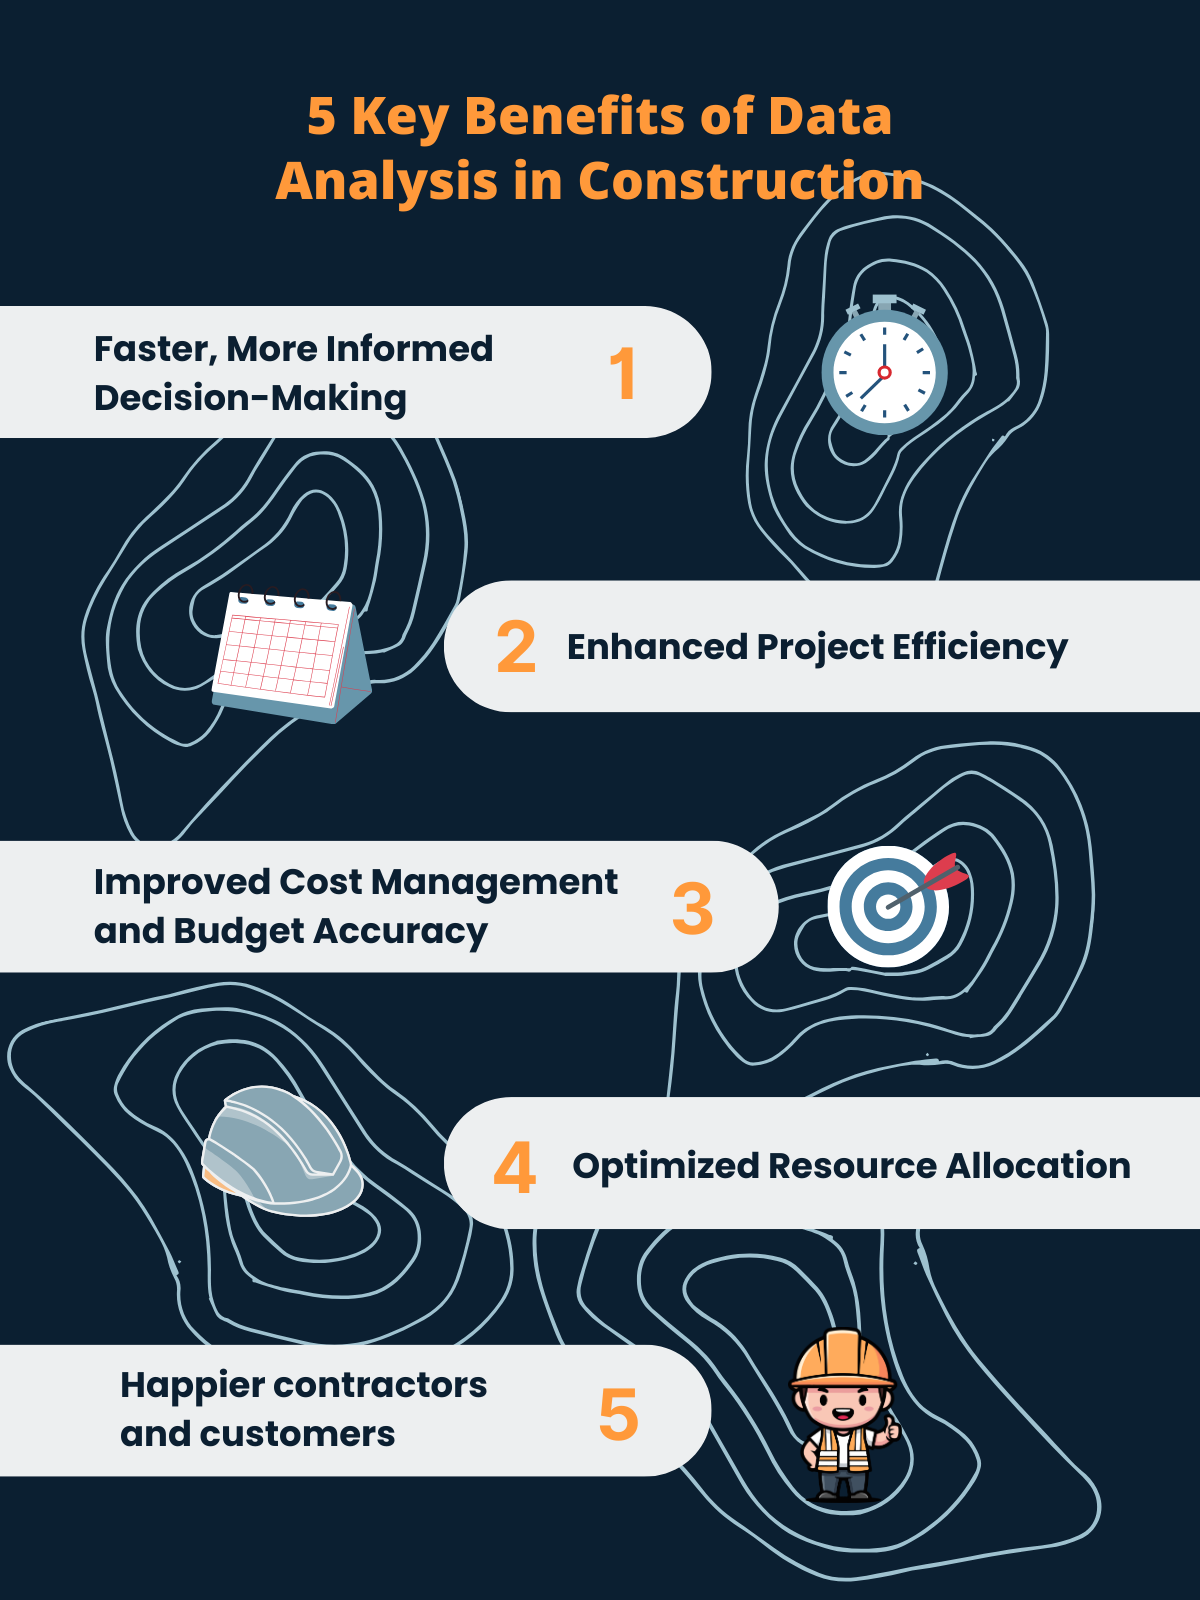
Key Benefits of Data Analysis in Construction
The analytical process described above delivers measurable benefits across multiple project dimensions. Understanding these benefits helps justify analytical investments and guides implementation priorities.
Faster, More Informed Decision-Making
Construction projects require constant decisions – resource allocation, sequencing adjustments, change order evaluations, risk responses. Data analysis accelerates decision-making while improving decision quality.
Real-Time Performance Visibility
Digital dashboards provide instant access to current project status. When problems emerge, managers receive immediate notifications rather than discovering issues during weekly meetings. This faster awareness enables intervention while corrective options remain plentiful and inexpensive.
Scenario Analysis
Data-driven tools enable rapid evaluation of alternative approaches. Project managers can model different resource allocations, sequence changes, or scope modifications, instantly seeing schedule and cost implications. This analytical capability supports better decisions than intuition alone.
Risk Quantification
Traditional risk management relies on subjective assessments ("high," "medium," "low"). Data analysis quantifies risk probabilities and potential impacts, supporting rational risk response investments proportional to actual exposure.
Improved Cost Management and Budget Accuracy
Beyond accelerating decisions, data analysis strengthens the financial management that determines project profitability.
Construction's thin profit margins demand precise cost control. Data analysis strengthens financial management through better forecasting and tighter expenditure control.
Accurate Cost Forecasting
Earned value analysis combines schedule and cost data to predict final project costs based on current performance. This forecasting alerts teams to budget problems months before traditional cost tracking reveals overruns, enabling corrective action while it remains effective.
Cost Variance Investigation
When costs exceed budgets, data analysis pinpoints specific causes – identifying which activities, materials, or resources drive overruns. This granular visibility focuses cost reduction efforts where they deliver maximum impact.
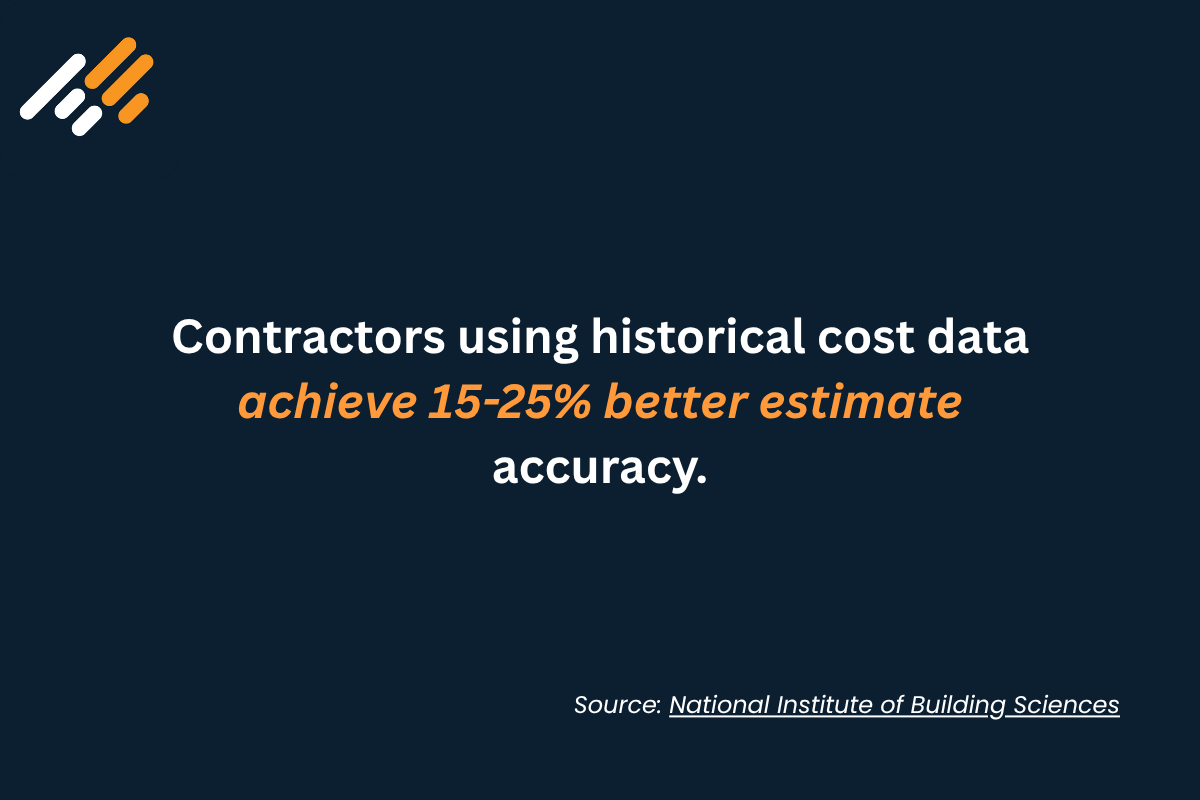
Historical Cost Intelligence
Analyzing completed project costs builds databases supporting more accurate future estimates. Contractors using historical cost data achieve 15-25% better estimate accuracy according to National Institute of Building Sciences research.
Enhanced Project Efficiency
Cost control matters, but efficiency improvements deliver even broader benefits by reducing waste and optimizing resource utilization throughout projects.
Efficiency improvements directly enhance profitability by reducing waste and optimizing resource utilization. Data analysis identifies efficiency opportunities invisible to traditional management.
Productivity Benchmarking
Comparing actual productivity rates against historical performance or industry standards reveals underperforming activities. Investigation of root causes – inadequate crew sizes, poor work sequences, material delays – enables targeted interventions that restore efficient operation.
Resource Utilization Optimization
Equipment represents major construction costs, yet many projects experience substantial idle time. Data analysis tracking equipment usage identifies underutilized assets that can be redeployed or released, reducing carrying costs.
Material Waste Reduction
Analyzing material procurement versus installation quantities reveals waste patterns. Data showing consistent over-ordering of certain materials supports procurement adjustments that reduce waste without risking shortages.
Optimized Resource Allocation
Construction projects succeed or fail based on resource deployment decisions – how many workers, which equipment, what material quantities. Data analysis improves these critical decisions.
Labor Force Sizing
Historical productivity data combined with remaining work quantities enables precise crew size calculations. This analytical approach prevents over-staffing (wasting costs) and under-staffing (causing delays).
Equipment Planning
Analyzing equipment usage patterns against project requirements supports optimal rental versus purchase decisions. Data showing high utilization justifies ownership investments, while low utilization supports rental strategies.
Material Delivery Scheduling
Integrating construction schedules with material lead times and storage capacity constraints enables just-in-time delivery optimization. This data-driven coordination reduces on-site inventory while preventing material shortages.
Achieving these benefits requires appropriate analytical tools that transform raw information into the actionable insights described above.
Common Tools and Techniques for Construction Data Analysis
Effective data analysis requires appropriate tools that transform raw information into actionable insights. Construction analytics employs multiple technologies, each serving specific analytical needs.
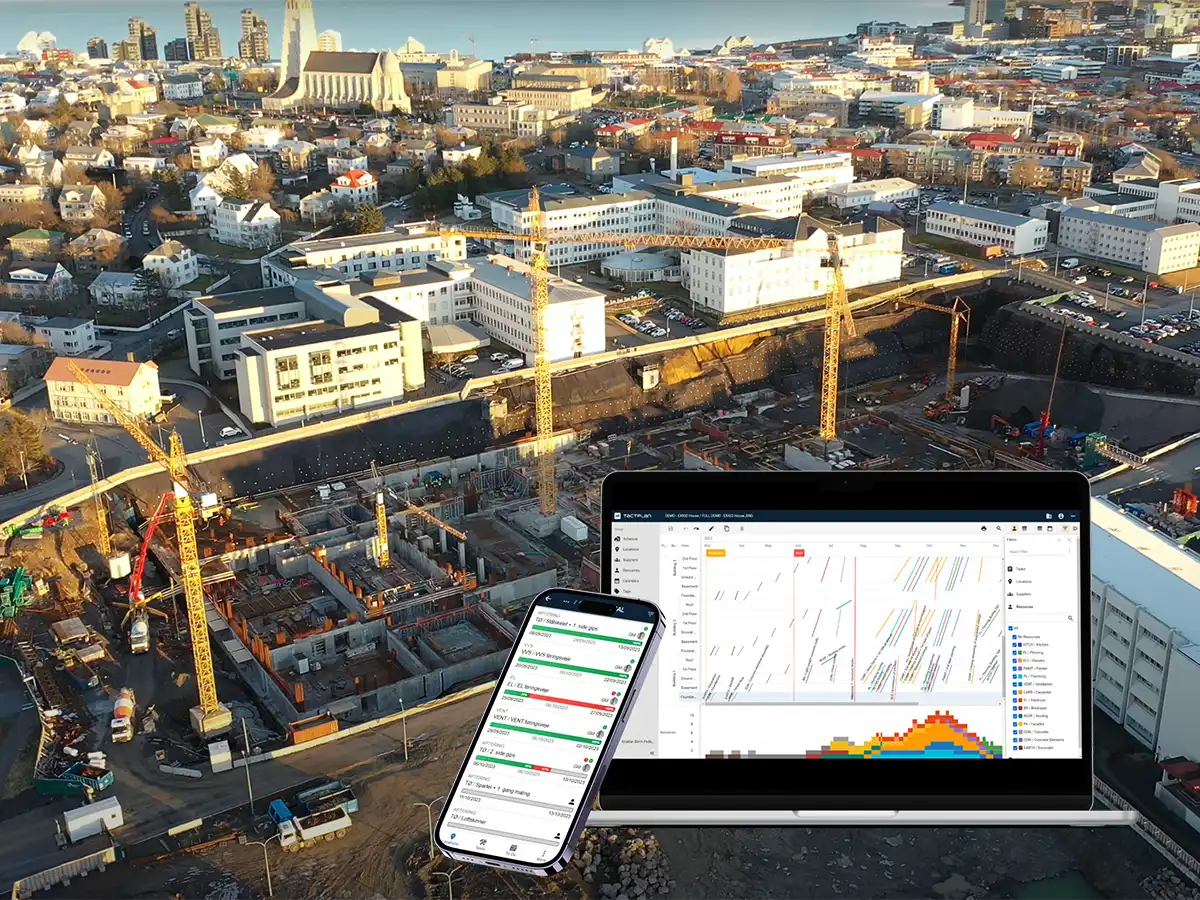
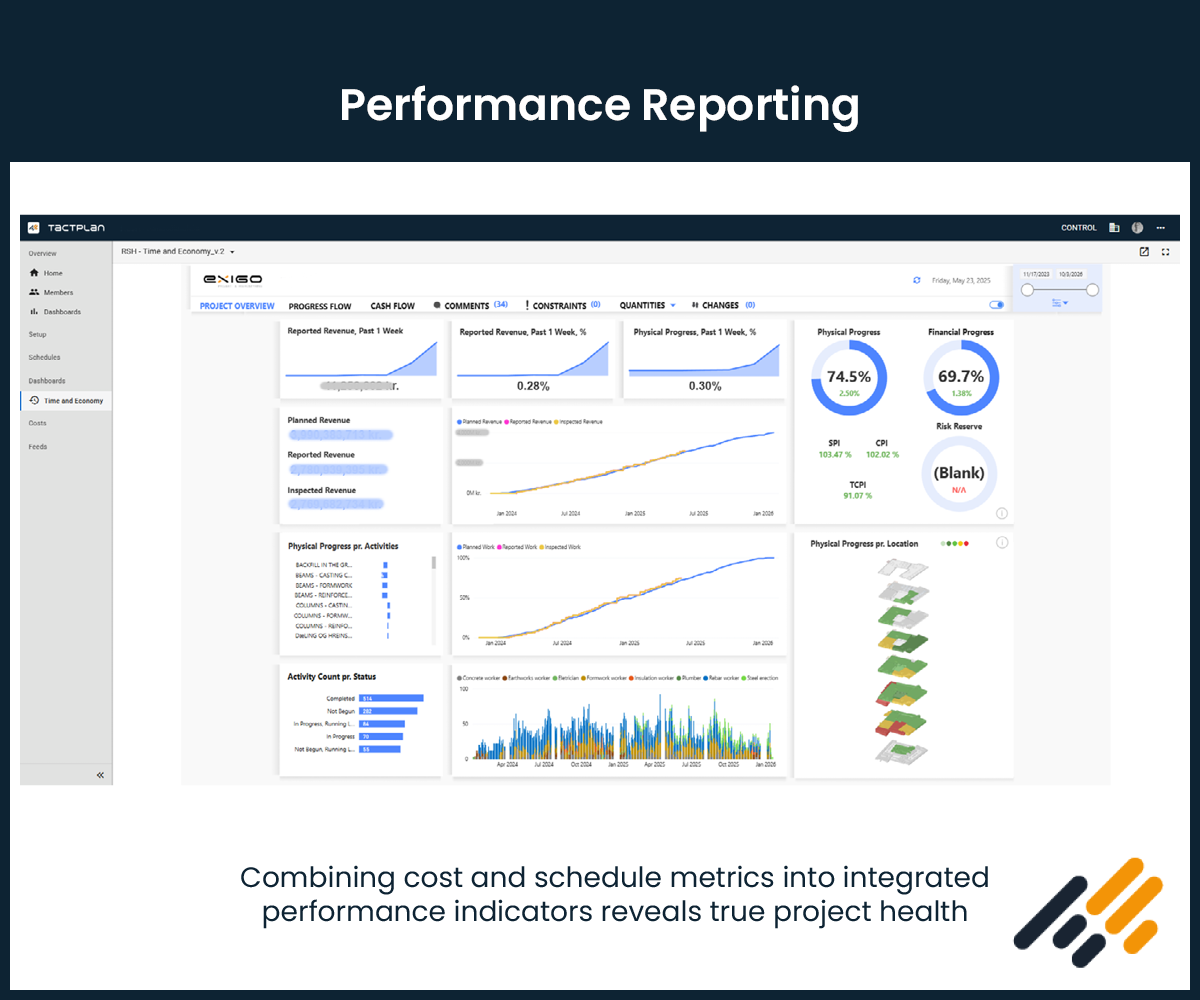
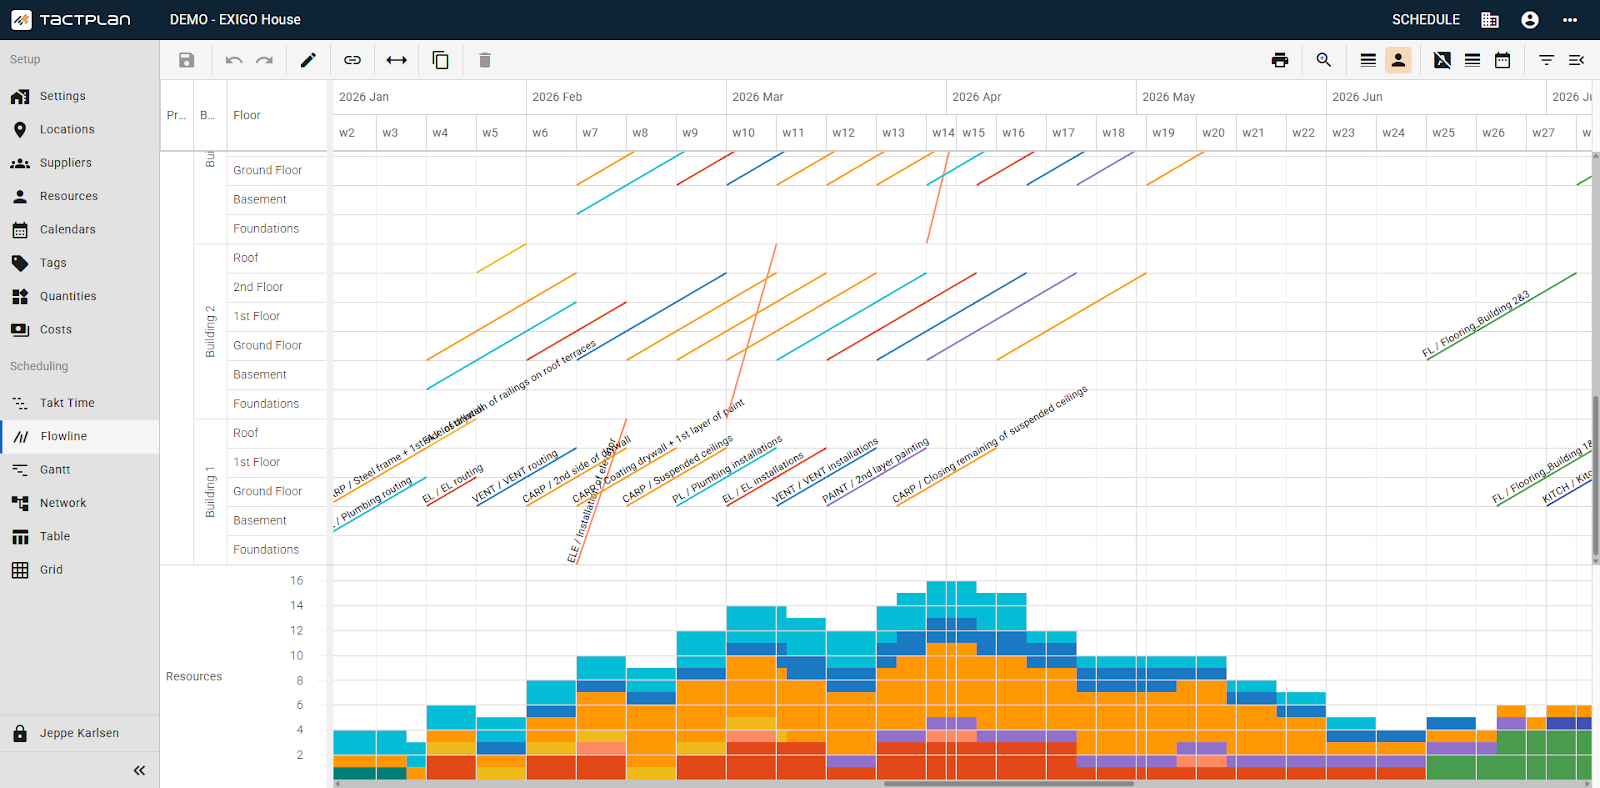
A practical way to leverage your scheduling data is through resource allocation. When you assign resources to activities in your location-based schedule, resource leveling becomes simple and intuitive. Comparing your planned resource allocation with the actual tracked resources on-site provides an efficient method for analyzing deviation causes and calculating the consequences of workforce adjustments. The figure below demonstrates how Tactplan integrates the line-of-balance view (flowline) with resource graphs for this analysis.
Data Visualization Dashboards
Visual presentation makes complex data comprehensible, enabling rapid pattern recognition and decision-making. Modern construction dashboards employ multiple visualization techniques:
Charts and Graphs
Time-series charts display performance trends, revealing whether metrics improve or deteriorate. Bar charts compare performance across locations, crews, or activities. Pie charts show budget allocations or cost distributions.
Heatmaps
Color-coded visualizations highlight problem areas requiring attention. Schedule heat maps show which locations fall behind plan. Cost heat maps identify budget elements experiencing overruns. Quality heat maps reveal defect concentrations.
Flowline Diagrams
Location-based scheduling platforms use flowline visualization showing work progression across building zones. These diagrams immediately reveal schedule conflicts, workflow interruptions, and coordination problems invisible in traditional Gantt charts.
"With flow lines (location-based scheduling), one can constantly see the impact of a change or if something shifts. The schedule on the project filled 40 A3 pages in Gantt. With flowlines, the schedule filled one A3 page. The biggest advantage of flowlines/location-based scheduling is clearly the overview you get." - Nina Fogh-Andersen, Project Manager, Arpe & Kjeldsholm
Project Result: Wakeup Copenhagen hotel delivered on time without overtime
Effective dashboards balance comprehensiveness with simplicity, providing necessary detail without overwhelming users. The best systems enable customization, allowing different stakeholders to configure views matching their specific needs.
"It's a completely different way to start a project. You plan time, activities, and locations simultaneously. It requires a bit more work at the beginning of the project, but it's all worth it. Once you 'get it,' it makes a lot of sense and provides a really good overview." — Simon Grønhøj Jensen, Construction Manager, Eurodan-huse
Project Result: 31 homes with Phase 1 delivered 1 month early, Phase 2 delivered 2 months early
BIM Integration for Real-Time Insights
Beyond data-driven analytics, integrating Building Information Modeling with data analysis creates another powerful capability layer. Building Information Modeling (BIM) provides rich three-dimensional project data. Integrating BIM with analytical platforms creates powerful capabilities:
4D Scheduling Visualization: Linking BIM models with construction schedules creates animated visualizations showing how projects build over time. This 4D capability enables early identification of spatial conflicts, access problems, and logistical challenges.
Quantity Extraction: BIM models contain detailed quantity information. Automated extraction of quantities from models eliminates manual takeoff errors and accelerates estimate preparation. Linking these quantities to scheduling and cost systems enables integrated analysis.
Progress Tracking: Comparing actual field conditions (captured through site photography or laser scanning) against BIM models provides precise progress measurement. This analysis reveals exactly which building elements are complete and which remain outstanding.
These analytical capabilities aren't just theoretical – leading construction firms are already achieving measurable results through systematic implementation.
Real-World Applications: Birch Properties' Data-Driven Success
Danish developer and general contractor Birch Properties demonstrates the transformative power of construction data analysis. The company implemented systematic data collection and analysis across their residential project portfolio, achieving remarkable results.
Location-Based Analytics
Rather than tracking aggregate project performance, Birch Properties analyzes data at the individual location level – specific floors, units, and building zones. According to Helle Kvartborg, Team Leader for Scheduling and Portfolio Management:
"By working with location division on projects, we get much more precise reporting of time and economics. A report stating that the schedule is 2 months delayed and has used 90% of the total budget doesn't give a real picture of exactly where the problem lies."
This granular analysis enables surgical interventions targeting specific problem areas rather than applying broad corrective measures that may not address root causes.
Early Problem Detection Through Data
Birch Properties' analytical approach identifies issues immediately rather than discovering them weeks later:
"Because we use location-based progress registration, we would discover the carpenter's delay immediately, not first when the delay has consequences for the subsequent electrician and painter, who either have to drive for nothing or wait."
This real-time problem detection stems from continuous data collection and automated variance analysis. When actual progress deviates from plan, the system immediately alerts managers, enabling same-day response rather than delayed reaction.
Data-Driven Process Improvement
Birch Properties extends data analysis beyond individual project management to systematic organizational learning:
"By diving into the collected data, we achieve precise understanding of where to focus efforts to improve processes."
Regular analysis of portfolio-wide data reveals patterns invisible within single projects – identifying which trades consistently perform well, which materials cause frequent problems, and which work sequences deliver best results. These insights drive standardization of best practices across all projects.
Financial Impact
The precision enabled by data analysis delivers measurable financial benefits:
"Looking at the complete picture, where it takes longer to make drainage, etc. due to difficult access conditions, and construction site costs must be increased due to schedule delay, it can total up to 1.5 million."
By identifying problems early through data analysis, Birch Properties prevents small issues from cascading into major cost impacts.
While Birch Properties' success is impressive, implementing data analytics isn't without obstacles. Understanding common challenges enables more successful adoption.
Challenges in Construction Data Analysis
Despite clear benefits, construction firms face significant challenges implementing effective data analytics. Understanding these obstacles enables proactive mitigation.
Data Accuracy and Consistency
The foundation of any analytical system is accurate data, yet construction environments present unique collection challenges.
Construction environments complicate data collection. Field personnel resist extensive documentation, mobile devices face harsh conditions, and varying technical capabilities affect data quality.
Incomplete Data
Projects often have gaps where data isn't collected or recording systems fail. Incomplete data undermines analysis, as algorithms cannot distinguish between "no work occurred" and "work occurred but wasn't recorded."
Inconsistent Data
When different project personnel record information using different methods or definitions, analysis becomes unreliable. For example, if some teams report productivity as hours per unit while others report units per hour, aggregate analysis produces meaningless results.
Data Entry Errors
Manual data entry introduces errors that corrupt analytical outputs. A single misplaced decimal point – recording 1.5 hours instead of 15 hours – can dramatically skew productivity calculations.
Addressing these challenges requires simplified collection interfaces designed for field conditions, automated validation that catches obvious errors, and systematic audits verifying data quality.
Learn more about how Tactplan Control ensures valid data collection in the field.

Skills Gap and Training Requirements
Beyond data quality issues, human factors significantly impact analytical success. Construction workforces traditionally lack data analytics training. Implementing analytical programs requires developing new organizational capabilities.
Technical Skills
Effective data analysis requires understanding statistical concepts, interpreting visualizations, and operating analytical software. Many construction professionals lack this background, necessitating substantial training investments.
Analytical Thinking
Beyond technical skills, data-driven management requires analytical mindsets – questioning assumptions, seeking evidence, and basing decisions on data rather than intuition. Shifting organizational culture toward analytical thinking often proves more challenging than developing technical skills.
Change Management
Introducing data analytics changes established workflows and decision processes. Resistance from personnel comfortable with traditional approaches can undermine implementation unless carefully managed through communication, training, and demonstrated value.
Implementation Costs
While organizations face implementation challenges including data quality issues, skills gaps, and financial investments in software licensing, IT infrastructure, and training programs, firms that successfully implement data analytics typically achieve returns on investment within 6-12 months through improved project performance, making initial costs economically justified—particularly when using purpose-built construction platforms.
Software for Effective Construction Data Analysis
Digital platforms transform construction data analysis from theoretical concept to practical reality. Modern construction management software integrates data collection, analysis, and visualization into unified systems.
Tactplan's Data-Driven Approach
Tactplan addresses construction data analysis through integrated platforms designed specifically for construction environments, combining location-based planning with comprehensive performance tracking.
Tactplan Schedule revolutionizes construction planning by implementing location-based scheduling that generates rich analytical data. Unlike traditional Gantt chart systems that only track temporal progress, Tactplan's location-based approach captures spatial information showing exactly where work occurs across construction zones.
This spatial data enables analytical capabilities impossible with conventional tools:
- Location-Based Productivity Analysis: Track productivity rates separately for each building zone, floor, or unit, identifying specific areas where performance exceeds or falls short of expectations
- Workflow Pattern Recognition: Visualize how work flows across the building, revealing coordination problems, trade conflicts, and optimization opportunities
- Resource Allocation Analytics: See exactly where labor and equipment are deployed versus where they're needed, supporting data-driven resource redeployment decisions
- Predictive Schedule Forecasting: Current performance trends automatically project future completion dates, providing early warning when schedule targets become unachievable
The platform's integration of quantities with scheduling creates natural productivity metrics without requiring separate tracking. When crews complete work in a location, the system enables automatic calculation of productivity as quantity completed divided by time elapsed, building historical productivity databases that improve future planning.
Tactplan Control delivers mobile-first data collection that connects field teams directly to analytical systems. Site supervisors update progress, report issues, and document conditions in real-time through interfaces designed for construction environments.
This real-time data capture eliminates the lag inherent in traditional weekly reporting cycles. When analytical systems receive continuously updated information, they provide current insights rather than outdated analyses of historical conditions. The result is analytics that actually guide daily decisions rather than merely documenting past performance.
The integration between Tactplan Schedule and Control creates powerful analytical feedback loops:
- Automated Variance Analysis: As field teams update actual progress, the system automatically compares reality against plans and calculates variances without manual analysis
- Trend Identification: Continuous data collection enables statistical trend analysis that reveals whether performance is improving, stable, or deteriorating
- Predictive Alerting: When current trends indicate future problems, the system proactively notifies managers rather than waiting for threshold breaches
- Continuous Learning: Every project builds organizational knowledge databases that improve estimating accuracy and risk assessment on future work
These current capabilities represent just the beginning of construction data analytics' evolution.
Embrace Data Analysis to Transform Your Construction Projects
Construction data analysis represents a fundamental shift from intuition-based management to evidence-driven decision-making. The evidence is clear: projects implementing systematic analytics achieve superior performance across multiple dimensions – finishing faster, costing less, and delivering higher quality than those using traditional approaches.
The benefits are quantifiable: 15-20% better schedule performance, 10-15% cost improvements, earlier problem detection, optimized resource allocation, and continuous organizational learning. These advantages compound over time as analytical capabilities mature and historical databases grow.
Implementation challenges exist – data quality concerns, skills gaps, and initial costs. However, firms that successfully navigate these obstacles consistently report returns on investment within the first year, making data analytics economically compelling beyond their operational benefits.
Modern construction management platforms like Tactplan Schedule and Control make sophisticated analytics accessible to contractors of all sizes, democratizing capabilities once available only to industry giants with extensive internal resources. Cloud-based systems eliminate infrastructure barriers while mobile-first designs ensure field teams can participate in data collection without disrupting productive work.
The construction industry's digital transformation is accelerating. Firms that master data analytics position themselves as industry leaders. The question isn't whether to implement construction data analytics, but how quickly you can develop these critical capabilities.
Ready to transform your construction management through data analysis? Discover how location-based scheduling and real-time progress tracking create the analytical foundation for predictable project delivery. Schedule a personalized demo and see how integrated data analytics can revolutionize your construction performance.