Construction projects generate massive amounts of data every single day. Crew hours, tasks progress, material deliveries, safety incidents, quality inspections, budget updates – the information flows constantly. Yet many construction firms struggle to transform this raw data into actionable insights that drive better decisions and improved project outcomes.
The difference between projects that finish on time and under budget versus those that spiral into costly delays often comes down to one critical factor: systematic performance measurement and metrics. Not to forget, regular updates of the plan, which are actually possible to effectively make because when construction KPIs are actively identified and measured from the beginning of a project.
When project teams track the right indicators and respond proactively to emerging trends, they gain the power needed to steer complex projects toward successful completion.
This comprehensive guide explores the construction metrics that matter most, how to implement effective measurement systems, and practical strategies for leveraging performance data to optimize project delivery.
Introduction to Construction Metrics
Understanding what construction metrics are and why they matter forms the foundation for building effective measurement systems.
Construction metrics are quantifiable measures that track specific aspects of project performance against established targets. These metrics transform subjective assessments like "the project seems on track" into objective measurements like "we're achieving 95% of planned productivity".
Definition: Construction metrics are standardized performance indicators that measure progress, efficiency, quality, safety, and financial performance across construction projects, enabling data-driven decision-making and continuous improvement.

Effective metrics serve multiple critical functions in construction management. They provide early warning signals when performance deviates from plan, enable accurate forecasting of future project conditions, support resource allocation decisions, and create accountability throughout project teams.
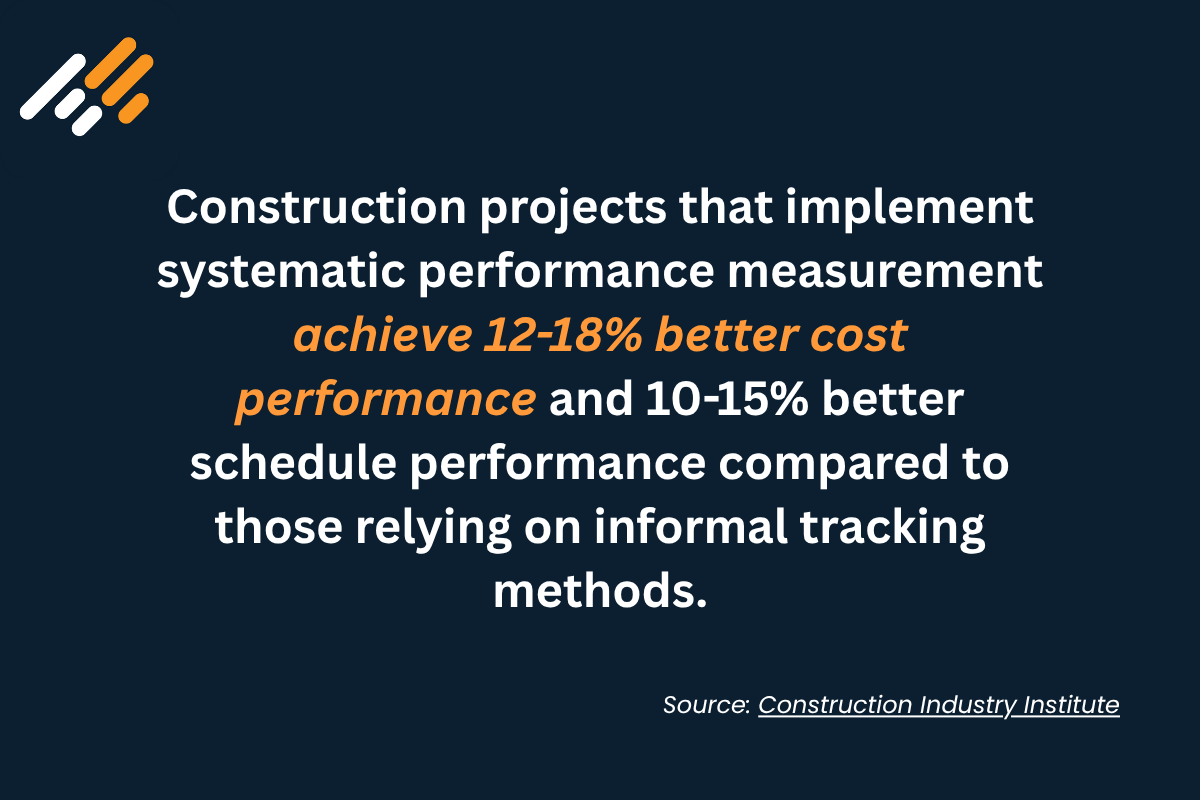
According to the Construction Industry Institute, projects that implement systematic performance measurement achieve 12-18% better cost performance and 10-15% better schedule performance compared to those relying on informal tracking methods. This improvement stems from faster identification of problems and more targeted corrective actions.
The most successful construction firms don't just collect metrics – they build measurement systems that deliver real-time visibility into project health, automatically flag concerning trends, and integrate seamlessly with daily workflows.
Types of Construction Metrics
Construction performance encompasses multiple dimensions, each requiring different metric categories to capture the full picture of project health. Understanding these categories helps project teams build comprehensive measurement systems that address all critical aspects of performance.
Project Management Metrics
Project management metrics track overall execution effectiveness, measuring whether projects progress according to plan and identifying coordination issues before they escalate. These metrics provide project managers with the visibility needed to make informed decisions about resource deployment, schedule adjustments, and risk mitigation strategies.
Schedule Variance: Measures the difference between planned and actual progress, revealing whether projects run ahead, on schedule, or behind. Expressed as percentage or time units, schedule variance enables quick assessment of timing performance. A variance of -5% indicates the project is 5% behind schedule.
Task Completion Rate: Tracks the percentage of planned activities completed within each reporting period. This metric reveals productivity trends and helps identify whether current work rates will support meeting future milestones. Construction projects targeting 100% planned task completion often achieve 85-90% in practice, with variations indicating potential problems. For example, Task Completion Rate below 70% would probably require additional measures.
Milestone Achievement: Monitors whether critical project milestones are met on scheduled dates. Unlike granular schedule variance, milestone achievement focuses on key decision points and handoff dates that external stakeholders track closely. Missing milestones often triggers contractual penalties or cascading delays in subsequent phases.
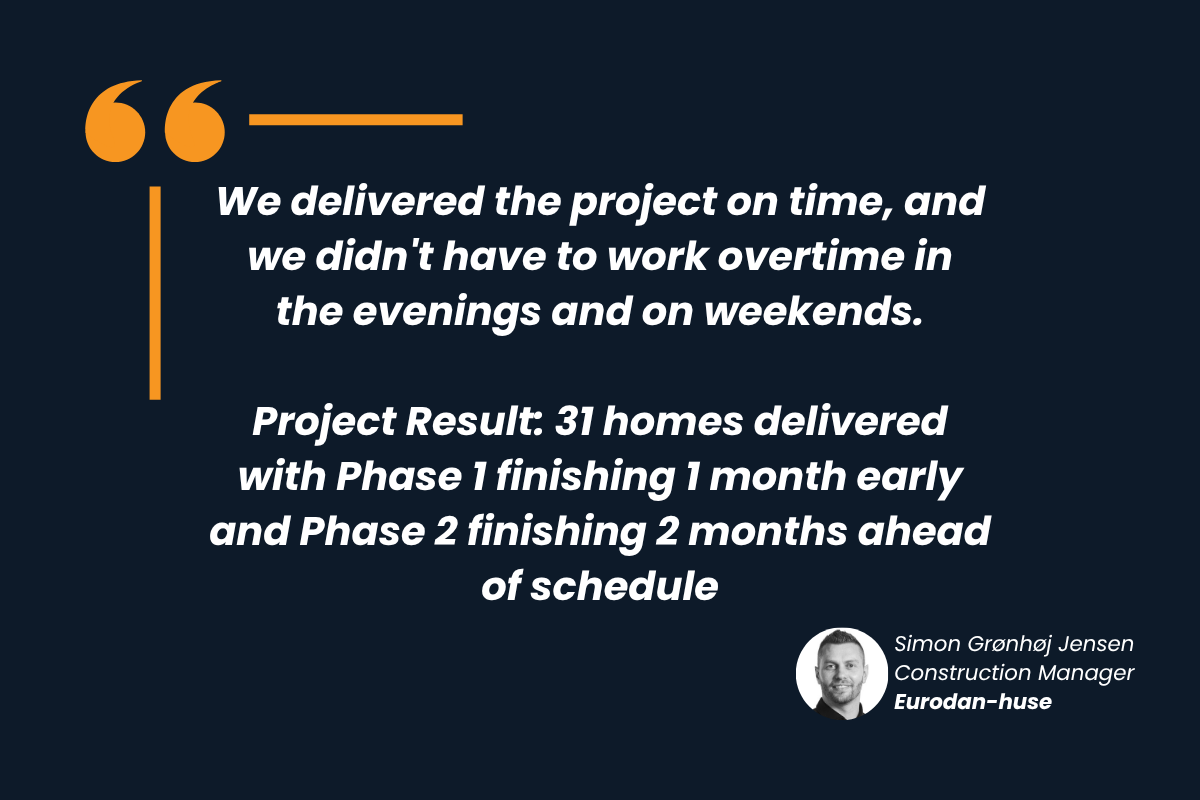
"We delivered the project on time, and we didn't have to work overtime in the evenings and on weekends." — Simon Grønhøj Jensen, Construction Manager, Eurodan-huse
Project Result: 31 homes delivered with Phase 1 finishing 1 month early and Phase 2 finishing 2 months ahead of schedule
Read the full case story from Eurodan-huse to learn more about how they used Tactplan for successful construction scheduling and keeping track of performance metrics.
Financial Metrics in Construction
Financial metrics provide crucial insight into whether projects stay within budget and generate expected margins, enabling proactive cost management.
Budget Variance: Compares actual costs against budgeted amounts, revealing cost overruns or savings. Calculated as (Actual Cost - Budgeted Cost) / Budgeted Cost, this metric highlights areas requiring cost control attention.
Cost Performance Index (CPI): Measures cost efficiency by comparing earned value to actual costs. CPI = Earned Value / Actual Cost, with values above 1.0 indicating better-than-planned performance and below 1.0 signaling overruns. Construction projects typically target CPI values between 0.95 and 1.05.
Gross Margin and Contribution Margin: These profitability metrics reveal the actual earnings after direct project costs. Gross margin shows total project profit after subtracting direct costs like subcontractor payments and materials. The gross margin ratio (also called contribution margin ratio or coverage ratio) is particularly critical for general contractors, as it indicates the percentage of revenue remaining after paying subcontractors and material suppliers – essentially, the money available to cover overhead and generate profit for the contractor.
Cash Flow Tracking: Monitors the timing of project expenditures and revenue, ensuring sufficient liquidity to meet obligations. Construction's payment structure – with progress payments lagging expenditures – makes cash flow monitoring essential for financial stability.

Safety Metrics
Beyond financial performance, construction safety metrics protect workers while meeting regulatory requirements and avoiding costly incidents. The Occupational Safety and Health Administration emphasizes that systematic safety measurement reduces incident rates and creates cultures where workers actively identify and mitigate hazards.
Total Recordable Incident Rate (TRIR): Standardizes safety performance measurement by calculating incidents per 200,000 work hours (equivalent to 100 full-time workers for one year). TRIR = (Number of Recordable Incidents × 200,000) / Total Hours Worked.
According to the U.S. Bureau of Labor Statistics, the construction industry averaged a TRIR of 2.3 in 2023, down from 2.4 in 2022. However, high-performing companies across industries aim for TRIR rates below 1.0, with construction safety leaders targeting this benchmark as a world-class standard.
Bearing in mind that the calculation of hours for a full-time worker may vary depending on your market.
Days Away, Restricted, or Transferred (DART) Rate: Measures more serious incidents that result in lost workdays, restricted duty, or job transfers. Like TRIR, DART rate normalizes data across projects of different sizes, enabling meaningful comparisons.
Near Miss Reporting Rate: Tracks reported near-miss incidents where accidents almost occurred but were avoided. Higher near-miss reporting often correlates with improved safety cultures.
Quality Metrics
Quality metrics ensure construction work meets specifications and client expectations while identifying systematic issues requiring process improvements.
Defect Density: Measures defects per unit of work completed. Tracking defect density reveals whether quality issues are increasing or decreasing. Increasing density suggests process problems requiring immediate attention.
Rework Percentage: Quantifies work that must be redone due to errors, expressed as rework hours divided by total hours. Construction industry averages range from 5-12%, with efficient projects achieving 3-5% rework rates.
Inspection Pass Rate: Tracks the percentage of inspections passed on first attempt without requiring corrections. Municipal inspections, quality control checks, and client walkthroughs all contribute to overall pass rates. Projects achieving 90%+ first-time pass rates typically experience smoother closeout processes.
Productivity Metrics
Completing the picture of construction performance, productivity metrics measure how effectively construction teams convert inputs (labor hours, equipment time, materials) into completed work. These metrics reveal whether current performance supports meeting schedules and budget targets.
Labor Productivity Rate: Calculates output per labor hour, enabling comparisons across crews, trades, and time periods. For example, drywall installation might be measured as square feet per labor hour, with typical rates ranging from 25-40 sq ft/hour depending on conditions.
Equipment Utilization: Tracks the percentage of time that equipment operates productively versus sitting idle. Construction equipment represents significant capital investment, making utilization monitoring essential for cost control. Target utilization rates vary by equipment type but generally exceed 60% for major machinery.
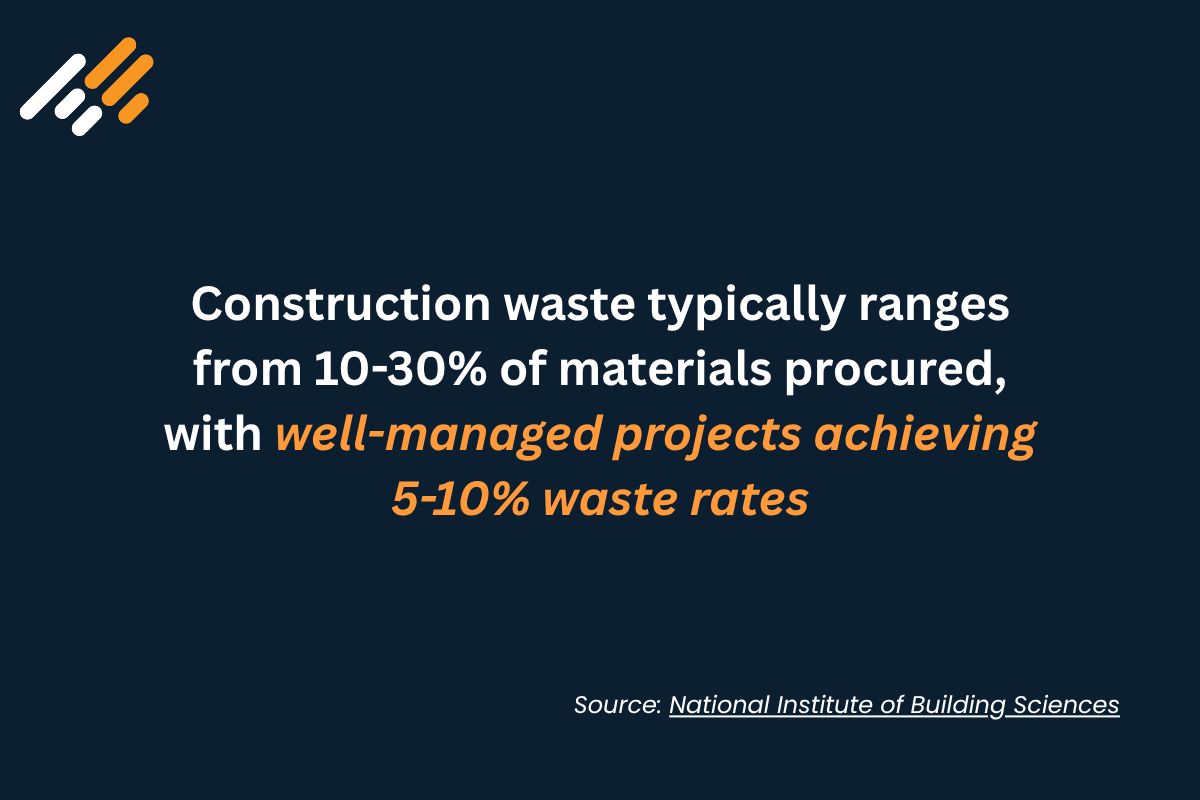
Material Waste Percentage: Measures materials discarded as waste compared to quantities installed, revealing procurement accuracy and installation efficiency. The National Institute of Building Sciences reports that construction waste typically ranges from 10-30% of materials procured, with well-managed projects achieving 5-10% waste rates.
While these metric categories provide essential structure for comprehensive performance tracking, certain performance indicators deserve special attention due to their ability to integrate multiple performance dimensions and support strategic decision-making.
Key Construction Performance Metrics
Beyond categorizing metrics by type, certain performance indicators provide particularly valuable insights for construction management. These key metrics integrate multiple performance dimensions and support strategic decision-making.
Cost Performance Index (CPI) and Schedule Performance Index (SPI)
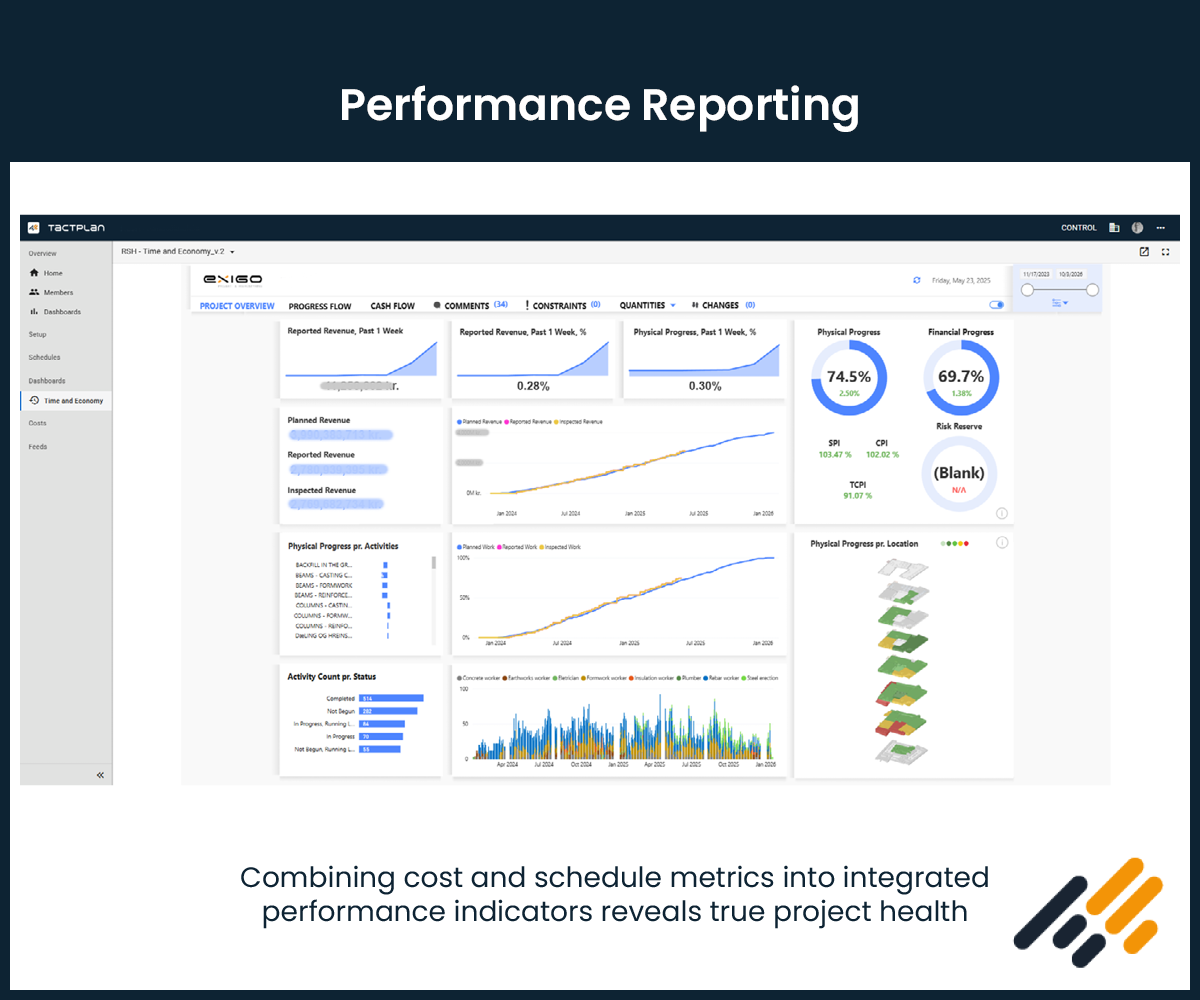
Earned Value Management (EVM) combines cost and schedule metrics into integrated performance indicators that reveal true project health. Unlike simple budget comparisons that ignore schedule status, EVM metrics account for both dimensions simultaneously.
Cost Performance Index calculates cost efficiency: CPI = Earned Value / Actual Cost. A project with $100,000 earned value and $95,000 actual cost achieves CPI of 1.05, indicating 5% better-than-planned cost performance. CPI values provide early warning of budget problems, typically appearing 15-20% into project duration and enabling corrective action while multiple options remain available.
Schedule Performance Index measures schedule efficiency: SPI = Earned Value / Planned Value. SPI below 1.0 indicates schedule delays, while values above 1.0 show ahead-of-schedule performance. However, SPI loses reliability as projects approach completion because planned value approaches total budget, mathematically pushing SPI toward 1.0 regardless of actual schedule status.
Earned Value Management Integration
EVM's true power emerges when CPI and SPI work together within an integrated framework, providing comprehensive project performance visibility by integrating three key values:
- Planned Value (PV): Budgeted cost of work scheduled
- Earned Value (EV): Budgeted cost of work actually completed
- Actual Cost (AC): Real costs incurred for completed work
These values enable powerful forecasting through formulas like Estimate at Completion (EAC) = Budget at Completion / CPI. Construction firms using EVM report 20-30% improvement in project outcome predictability according to Project Management Institute research.
Labor Productivity Measurement
Labor productivity provides crucial insights where labor represents 40-50% of project costs, enabling benchmarking and realistic estimation.
Unit Rate Productivity: Measures output per hour for specific tasks (concrete yards placed per hour, pipe installed per hour, flooring completed per hour). Tracking unit rates reveals productivity trends and identifies high-performing crews.
Factors Affecting Construction Productivity: Multiple variables influence productivity including weather conditions, site congestion, material availability, and crew experience. Sophisticated tracking accounts for these factors, normalizing comparisons across different conditions.
Equipment Efficiency Tracking
Equipment represents substantial investment, making efficiency tracking essential. Metrics reveal whether assets generate expected returns.
Utilization Rate = (Productive Hours / Available Hours) × 100. Low utilization might indicate over-capacity or scheduling issues. Target utilization varies by equipment type – smaller tools should approach 80% while specialized equipment might target 50-60%.
Cost per Productive Hour: Tracks total equipment costs divided by productive hours, supporting rent-versus-buy decisions.
Understanding these metrics is essential, but knowing which ones to track for your specific project context separates effective measurement from data overload.
How to Choose the Right Construction Metrics for Your Project
Not all metrics provide equal value for every project. The most effective measurement systems focus on metrics that drive decisions rather than creating data collections that overwhelm users.
Aligning Metrics with Project Goals
Metric selection should start with clear project objectives. Fast-track projects emphasize schedule metrics like milestone achievement. Cost-sensitive projects prioritize financial indicators like CPI. High-profile public projects often emphasize safety metrics.
Complex projects benefit from leading indicators that predict future performance rather than lagging indicators reporting only past results.
Using Metrics for Early Problem Detection
The greatest value from metrics comes from early problem identification when corrective options remain plentiful and inexpensive.
Trend Analysis: Effective systems track trends over time. A schedule performance index declining from 1.05 to 0.98 over three periods signals emerging pressure requiring attention.
Threshold Alerting: Automated alerts when metrics exceed acceptable ranges enable faster response, triggering investigation before variances compound.
Predictive Forecasting: Historical patterns enable forecasting future performance, supporting proactive intervention rather than hoping performance improves spontaneously.
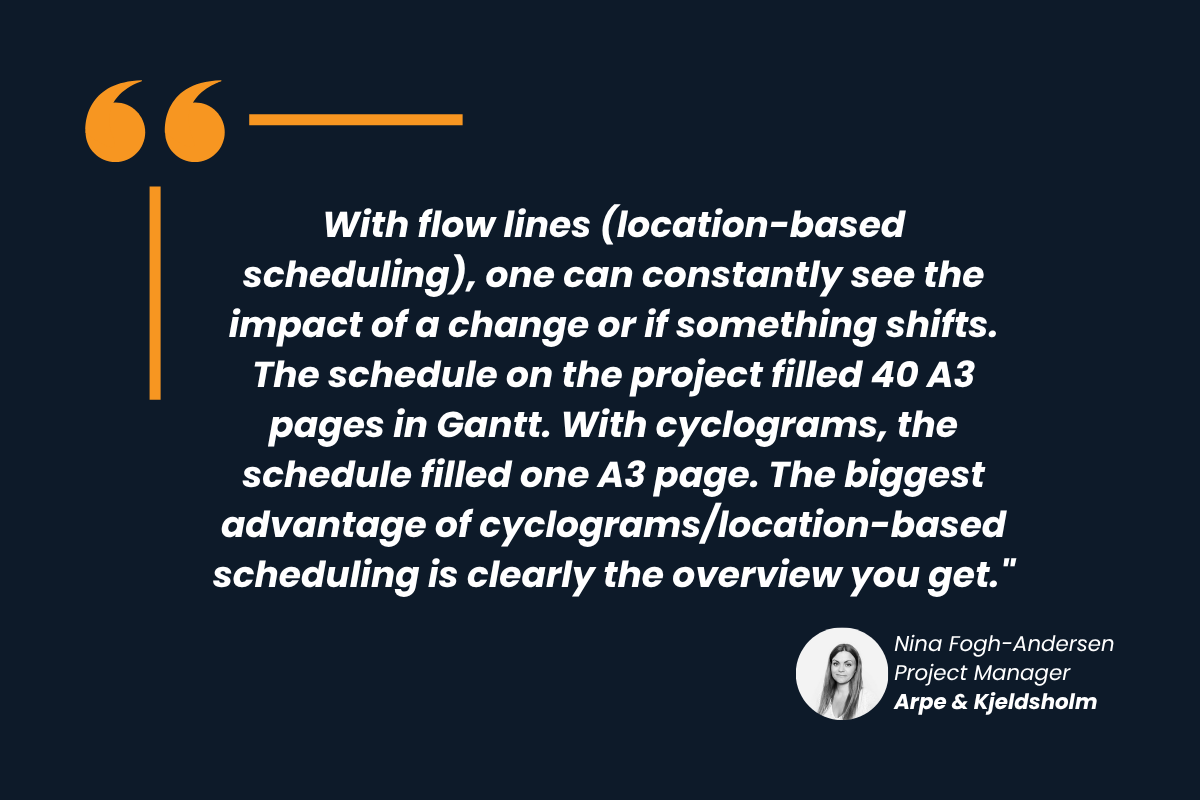
"With flow lines (location-based scheduling), one can constantly see the impact of a change or if something shifts. The schedule on the project filled 40 A3 pages in Gantt. With flowlines, the schedule filled one A3 page. The biggest advantage of flowlines/location-based scheduling is clearly the overview you get." - Nina Fogh-Andersen, Project Manager, Arpe & Kjeldsholm
Project Result: Wakeup Copenhagen hotel delivered on time without overtime
Achieving this level of sophisticated metric tracking and early problem detection requires digital tools purpose-built for construction environments.
Tools and Software for Tracking Construction Metrics
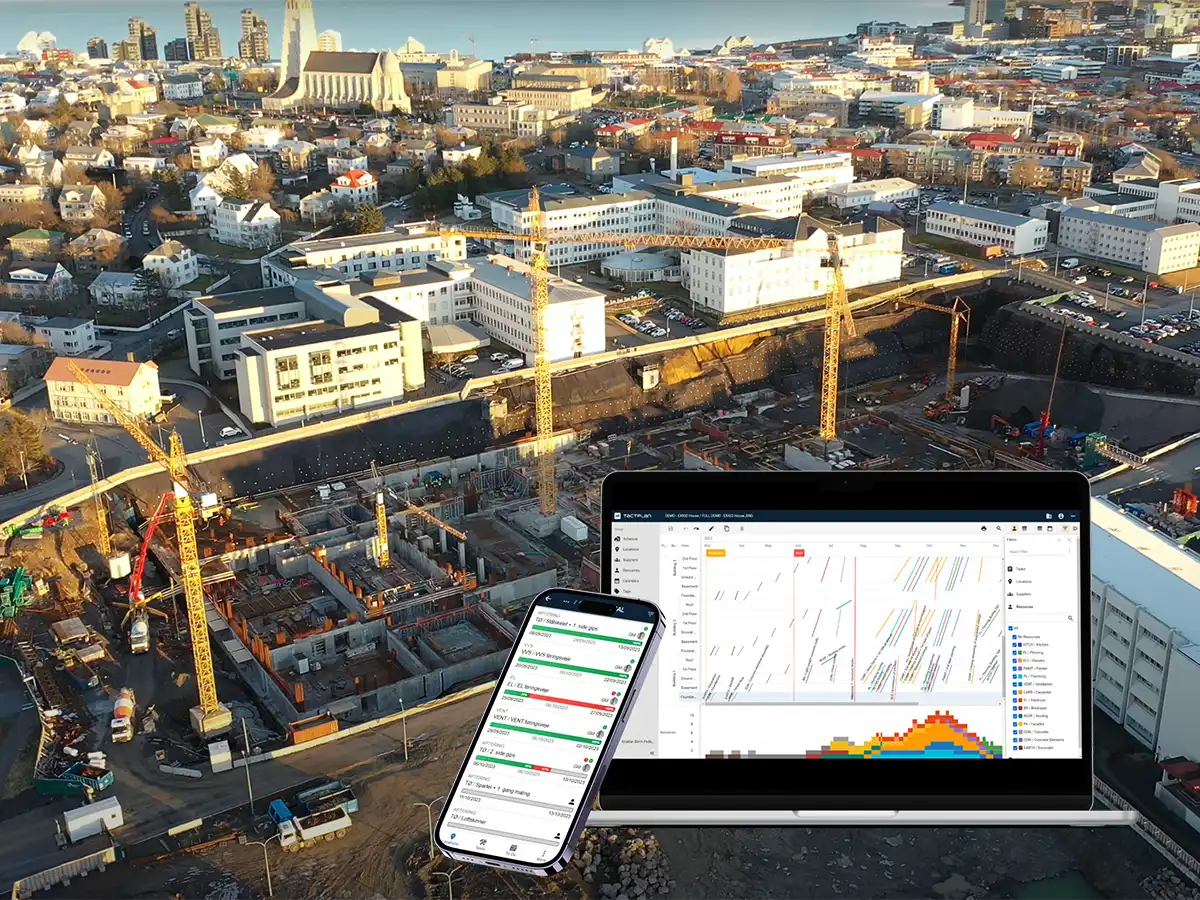
Modern construction management requires digital tools that collect, analyze, and visualize performance metrics in real-time. Manual spreadsheet tracking cannot keep pace with the data volumes and analysis needs of contemporary projects.
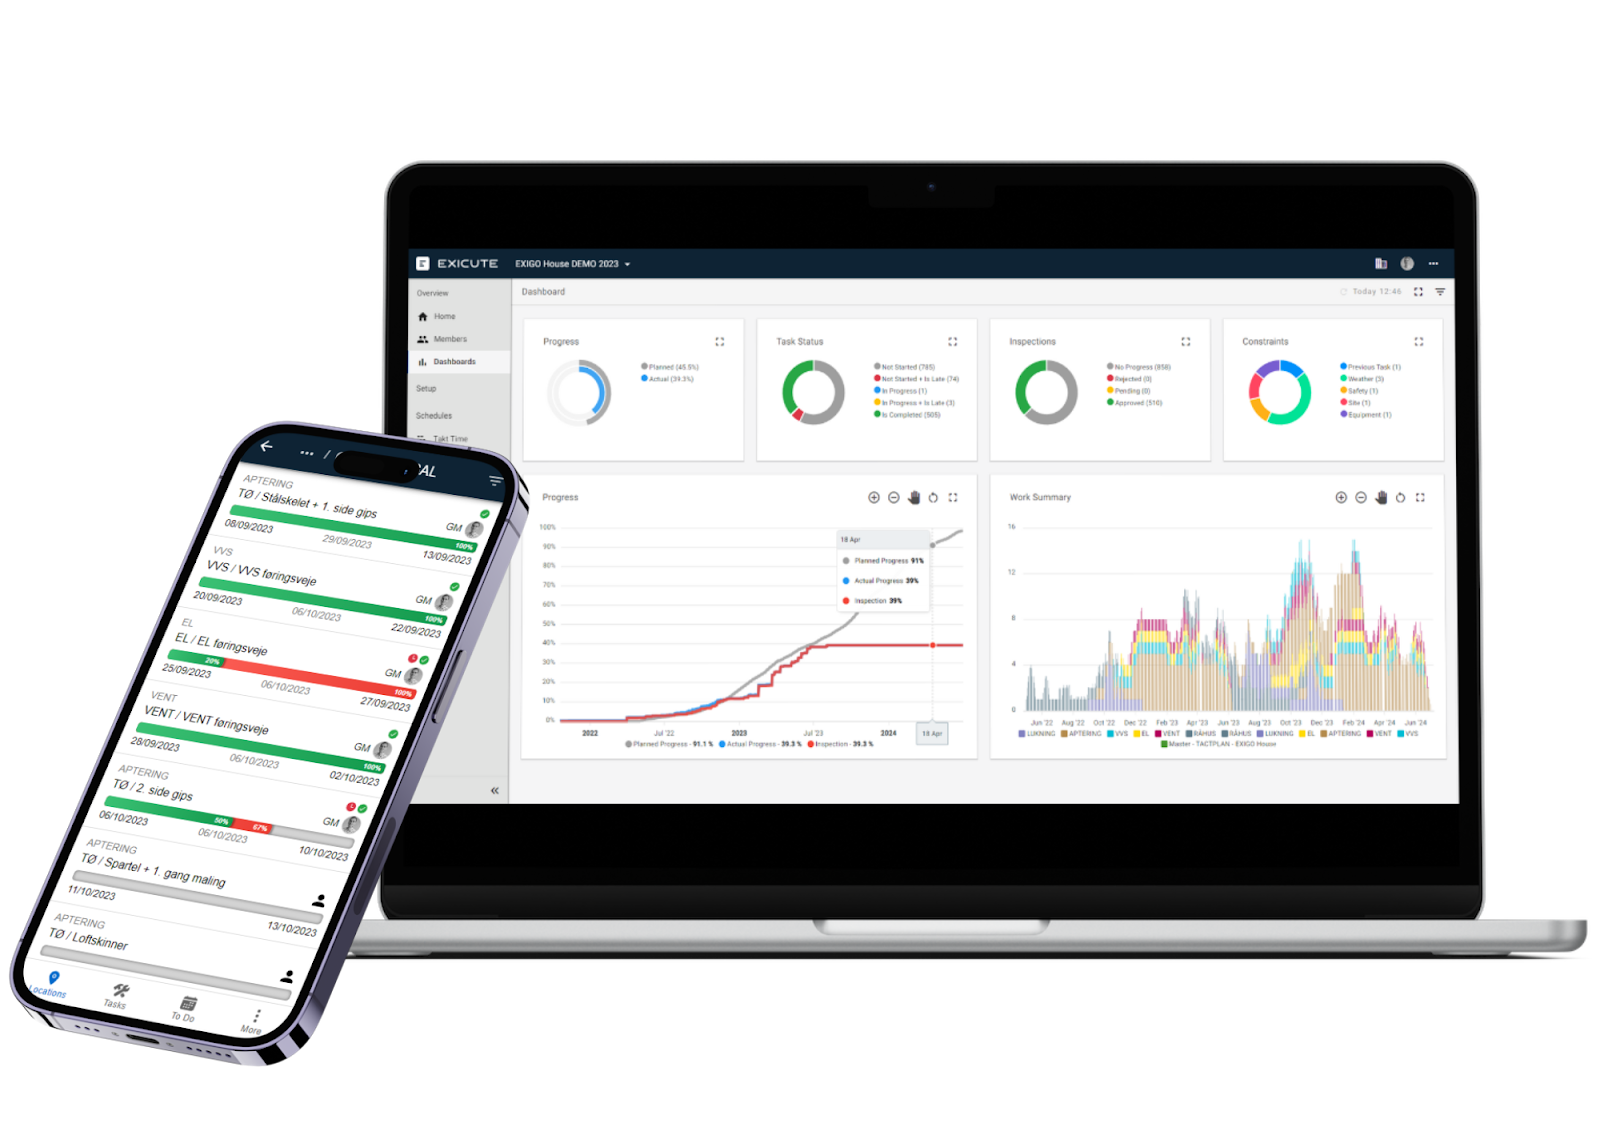
Construction Performance Dashboards
Effective metric tracking depends on intuitive visualization that enables rapid comprehension of complex performance data. Digital dashboards aggregate multiple metrics into unified views that reveal project health at a glance.
Real-Time Data Integration: The most valuable dashboards pull current data directly from source systems rather than requiring manual updates. When field crews update progress through mobile apps, dashboards immediately reflect new information, ensuring decision-makers work with current data.
Customizable Views: Different stakeholders need different metric presentations. Project executives want high-level KPI summaries while superintendents need detailed productivity breakdowns by crew and location. Effective dashboard systems support multiple view configurations serving various user needs.
Alert Mechanisms: Automated notifications when metrics exceed thresholds ensure problems receive immediate attention. Rather than requiring users to check dashboards constantly, alert systems push critical information to decision-makers.
Tactplan's Integrated Measurement Approach
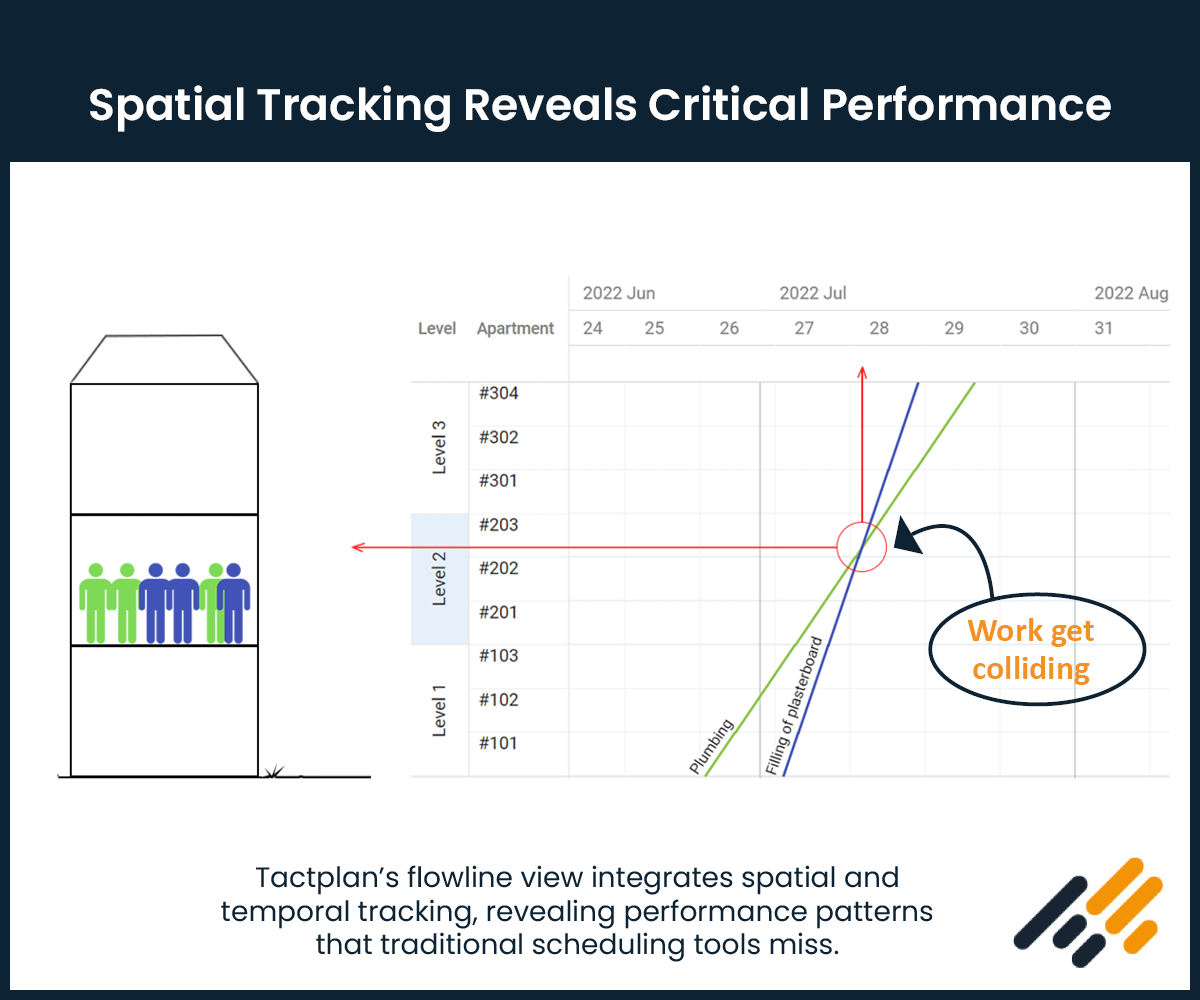
Among construction management platforms, Tactplan addresses metric tracking through integrated systems specifically designed for construction performance management, combining spatial and temporal tracking in ways traditional tools cannot match.
Tactplan Schedule provides location-based planning that creates the foundation for accurate performance measurement. Unlike traditional Gantt chart systems that only track temporal progress, Tactplan's location-based approach enables metrics that account for spatial progress across construction zones.
This spatial tracking reveals critical performance patterns invisible in conventional systems. When productivity varies by location or floor, Tactplan's visualization immediately highlights these differences, enabling targeted investigation and correction. The platform's integration of quantities with scheduling creates natural productivity metrics (quantity completed per time unit) without requiring separate tracking systems.
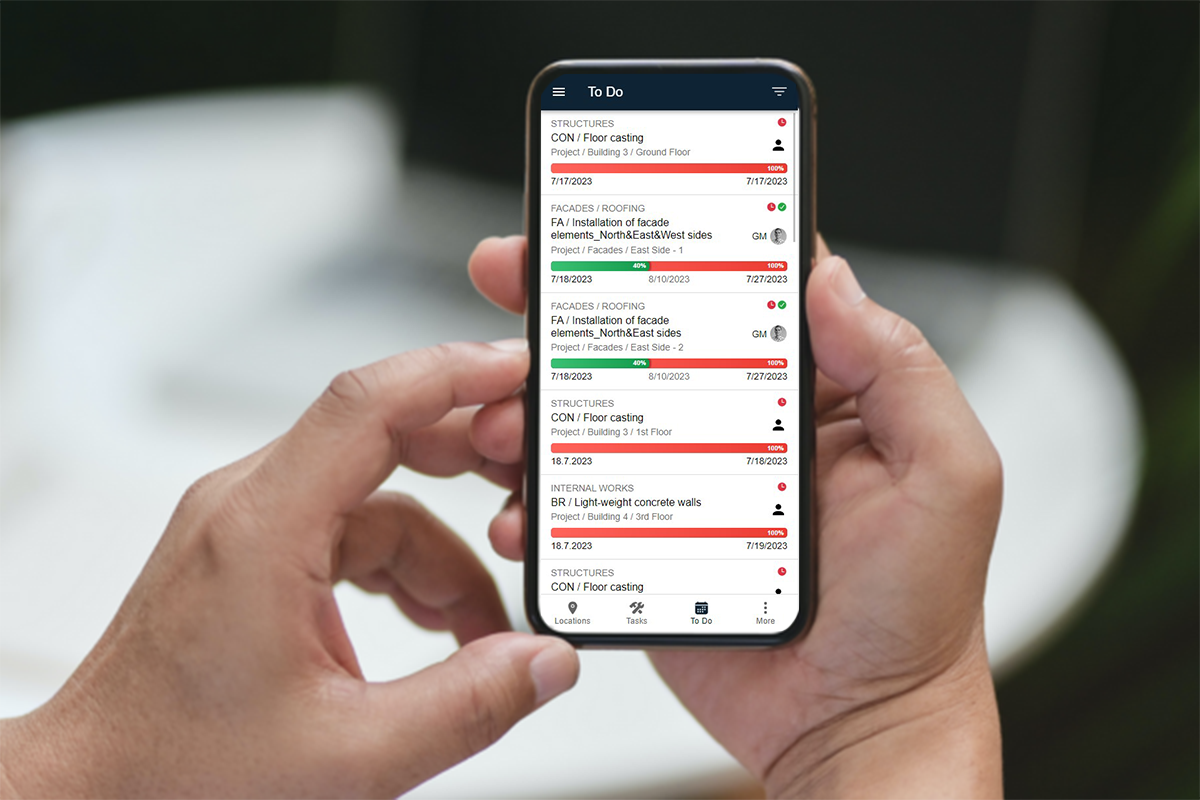
Tactplan Control delivers mobile-first progress tracking that connects field teams directly to performance measurement systems. Site supervisors update progress, report issues, and document conditions in real-time through ruggedized mobile interfaces designed for construction environments.
This real-time connectivity eliminates the lag inherent in traditional weekly reporting cycles. When a crew falls behind plan, Tactplan Control captures that variance immediately, triggering alerts and enabling same-day corrective action rather than discovering problems days or weeks later during progress meetings.
The integration between Tactplan Schedule and Control creates powerful metric capabilities:
- Automated Schedule Performance Calculation: As crews update actual progress, the system automatically calculates schedule variance and productivity rates without manual data entry
- Location-Based Productivity Tracking: See exactly which building areas or floors achieve target productivity and which require attention
- Visual Performance Trends: Track metrics over time through intuitive charts that reveal patterns and predict future performance
- Predictive Schedule Forecasting: Current performance trends automatically project completion dates, revealing whether schedule targets remain achievable
These capabilities aren't just theoretical features – leading construction firms are already achieving measurable results through systematic metric implementation.
Real-World Example: Birch Properties Metrics Success
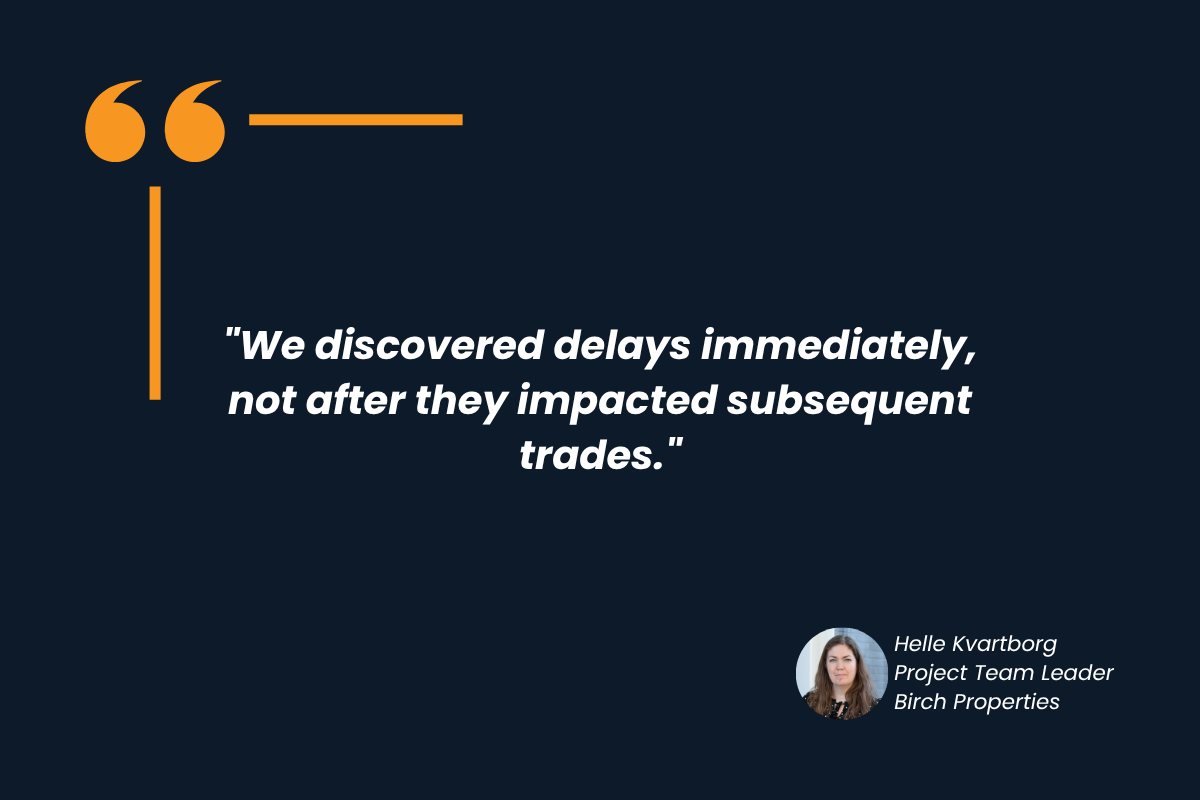
Danish developer Birch Properties demonstrates how systematic metric tracking transforms project delivery. According to Helle Kvartborg, Team Leader for Scheduling and Portfolio Management:
"By working with location-based project management regarding both time and economics, we get much more precise reporting. A report stating that the schedule is 2 months delayed and has used 90% of the total budget doesn't give a real picture of exactly where the problem lies."
Location-Based Performance Tracking: Birch Properties implemented granular metrics that track performance by specific building locations rather than aggregate project totals. This approach immediately reveals which crews or locations drive overall variances: "Because we use location-based progress tracking, we would discover the carpenter's delay immediately, not first when the delay has consequences for the subsequent electrician and painter."
Early Problem Detection: The precision of Birch Properties' metrics enables intervention before small problems cascade: "The key here is to discover challenges early, so we can react in time and correct course." When metrics show a single location falling behind, teams can add resources or adjust sequencing while the variance remains manageable.
Data-Driven Process Improvement: Systematic metric collection across multiple projects enables continuous improvement: "By diving into the collected data, we achieve precise understanding of where to focus efforts to improve processes." Rather than repeating mistakes across projects, Birch Properties learns from performance patterns and implements systematic improvements.
Portfolio-Level Visibility: Birch Properties extends metric tracking across their entire project portfolio, revealing resource allocation patterns and contractor performance trends that single-project tracking would miss. This portfolio perspective supports strategic decisions about contractor partnerships and resource deployment.
While Birch Properties' success demonstrates the power of systematic metrics, implementing such systems isn't without obstacles. Understanding common challenges enables more successful adoption.
Common Challenges in Using Construction Metrics
Despite clear benefits, construction firms frequently struggle with metric implementation. Understanding common challenges enables proactive mitigation strategies that improve adoption success.
Data Collection Accuracy
The foundation of any metric system is accurate data, yet construction environments present unique collection challenges.
Construction sites present challenging environments for data collection. Crews focused on production resist extensive documentation requirements and mobile devices face harsh conditions.
Simplify Collection Interfaces: The most successful metric systems minimize data entry requirements through intuitive mobile interfaces designed for field conditions. When updating progress requires ten taps instead of two, compliance drops dramatically.
Integrate with Existing Workflows: Rather than creating separate metric tracking processes, effective systems embed measurement into activities crews already perform. For example, when crews are on site, they simultaneously update progress directly through mobile apps designed for rapid, on-site input, eliminating the need for separate note-taking and later data entry. This connects tools to simplify the workflow through automation, rather than creating an additional maintenance burden.
Validate Data Quality: Even well-designed systems require periodic audits ensuring data accuracy. Spot-checking progress updates against physical observations identifies systematic errors and enables training before problems compound.
Technology Adoption Resistance
Beyond data quality challenges, human factors significantly impact measurement success.
Implementing new technologies in the construction industry presents challenges due to the diverse configurations of projects and inherently less controllable site conditions. This environment makes metric implementation difficult, regardless of a system's capabilities.
As with any other industry and company looking to implement new technologies to improve workflows between sometimes siloed groups of employees, adoption and therefore change management is of great importance to succeed.
Demonstrate Quick Wins: Rather than attempting wholesale transformation, successful implementations start with focused pilots that demonstrate clear value. When early results show metric systems identifying problems that would otherwise remain hidden, skepticism decreases and adoption accelerates.
Involve Field Personnel Early: Including crews in system selection and configuration improves adoption by ensuring tools address real needs rather than theoretical requirements. When workers help design measurement systems, they take ownership of implementation success.
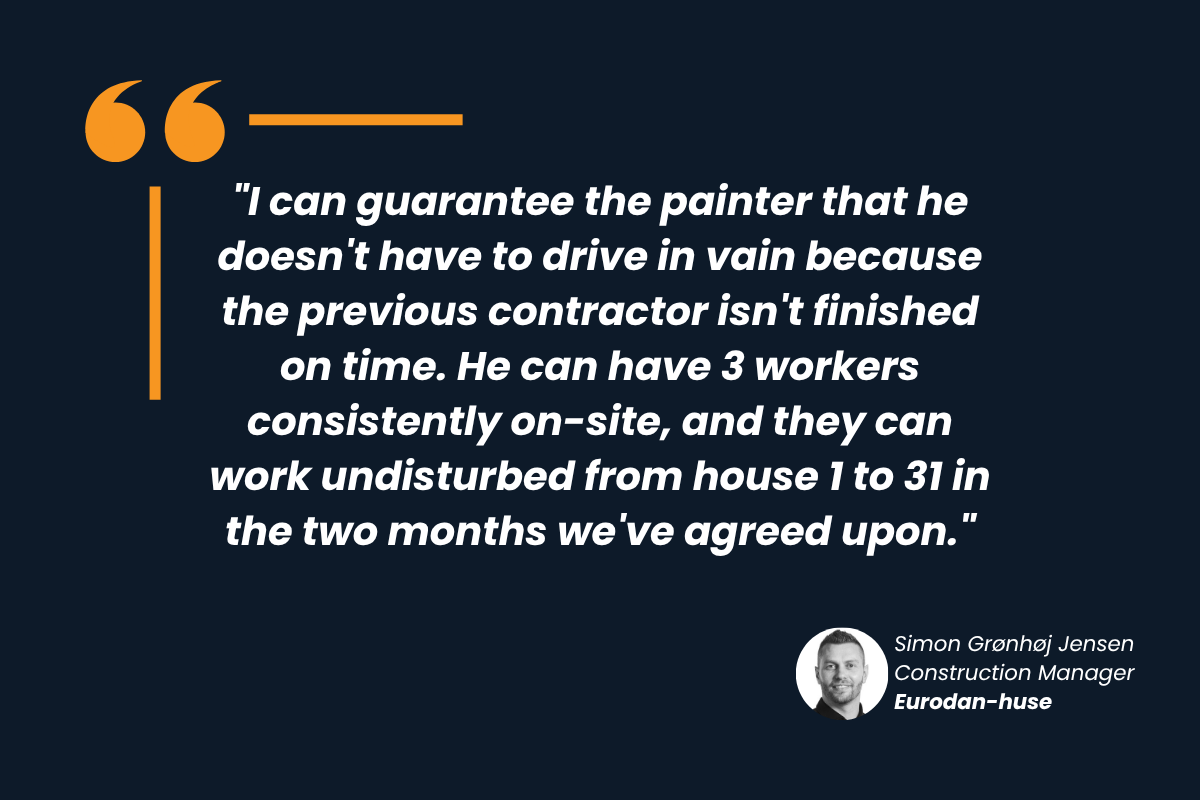
"I can guarantee the painter that he doesn't have to drive in vain because the previous contractor isn't finished on time. He can have 3 workers consistently on-site, and they can work undisturbed from house 1 to 31 in the two months we've agreed upon."
— Simon Grønhøj Jensen, Construction Manager, Eurodan-huse
Provide Adequate Training: Technology resistance often stems from inadequate training that leaves users frustrated and uncertain. Comprehensive training programs combining classroom instruction with on-site coaching ensure users develop confidence and competence.
You can learn more about our training options by visiting Tactplan Academy.
Analysis Paralysis and Information Overload
Even when teams embrace technology and collect accurate data, they can still struggle with making sense of the information.
Construction firms sometimes implement excessive metrics, overwhelming users with data volumes that obscure critical insights. When dashboards display fifty indicators, decision-makers struggle to identify which metrics require immediate attention.
Focus on Actionable Metrics: Effective measurement systems prioritize metrics that trigger specific decisions over comprehensive data collection. If a metric doesn't inform concrete actions, question whether it deserves tracking.
Implement Tiered Reporting: Different organizational levels need different metric details. Executives need KPI summaries while superintendents need granular productivity breakdowns. Tiered reporting ensures each audience receives appropriate information depth.
Establish Clear Response Protocols: Metrics without associated action plans create measurement without improvement. Define specific responses triggered by metric thresholds: when productivity drops below 80% of plan, what happens? Clear protocols convert measurement into management action.
Successfully navigating these challenges positions organizations to capture the full strategic value of performance measurement and participate in the industry's digital transformation.
Conclusion: The Future of Construction Metrics
Construction metrics represent far more than administrative tracking requirements – they form the foundation for data-driven project management that consistently delivers better outcomes. Projects implementing systematic performance measurement achieve superior cost and schedule performance while building organizational capabilities that compound over time.
The construction industry is shifting toward predictive analytics and real-time performance management. Modern digital platforms enable measurement sophistication previously available only to elite firms with extensive internal capabilities. Cloud-based construction management systems democratize advanced metrics, making them accessible to contractors of all sizes.
Integrated Project Ecosystems: Metrics will flow seamlessly across specialized systems – scheduling platforms, cost control software, quality management tools, and safety tracking applications – providing unified performance visibility without manual data integration.
Portfolio Intelligence: Leading firms are extending metric tracking beyond individual projects to portfolio-level analysis that reveals systematic patterns and improvement opportunities. This strategic perspective supports better decisions about resource allocation, process standardization, and competitive positioning.
The firms that master construction metrics gain competitive advantages that strengthen over time. Better measurement drives better decisions, which improve outcomes, which generate more data for analysis – creating virtuous cycles of continuous improvement that separate industry leaders from followers.
Ready to transform your construction performance measurement? Schedule a personalized demo and see how integrated performance management can elevate your project success rates.